使用 grafana + influxdb + telegraf 建立監控
Grafana 安裝
以下用 yum 方式安裝 Grafanae-8.2.3-1
wget https://dl.grafana.com/enterprise/release/grafana-enterprise-8.2.3-1.x86_64.rpm

yum localinstall grafana-enterprise-8.2.3-1.x86_64.rpm

systemctl start grafana-server

systemctl status grafana-server
InfluxDB 、 Telegraf 安裝
以下用 yum 方式安裝 InfluxDB v1.8.0 Telegraf v1.24.1
cat <<EOF | tee /etc/yum.repos.d/influxdata.repo
[influxdata]
name: InfluxData Repository - Stable
baseurl: https://repos.influxdata.com/stable/\$basearch/main
enabled: 1
gpgcheck: 1
gpgkey: https://repos.influxdata.com/influxdata-archive_compat.key
EOF

yum install influxdb telegraf
Step.1 修改 Telegraf 的設定檔並啟動:
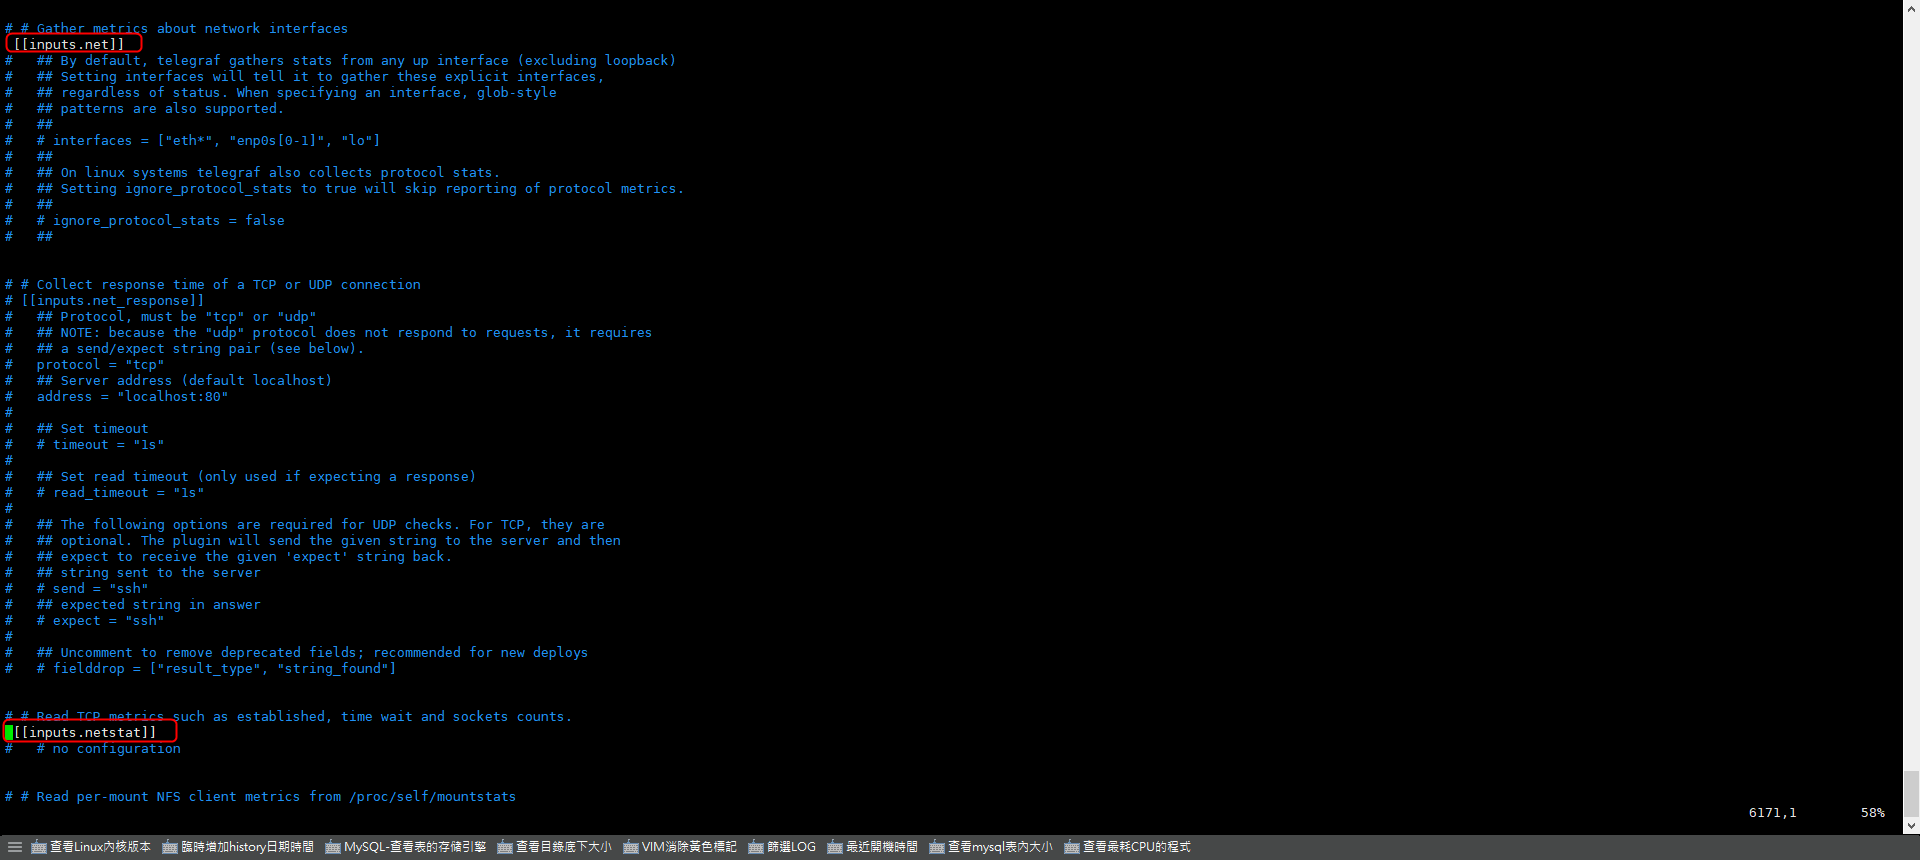
將 output-influxdb 打開並指向 database-telegraf , 打開 network 跟其他參數 , 新增使用者
[[inputs.net]]

[[inputs.netstat]]

[[inputs.interrupts]]

[[inputs.linux_sysctl_fs]]

[[inputs.conntrack]]

[[inputs.nstat]]

[[inputs.ntpq]]

[[inputs.logparser]]
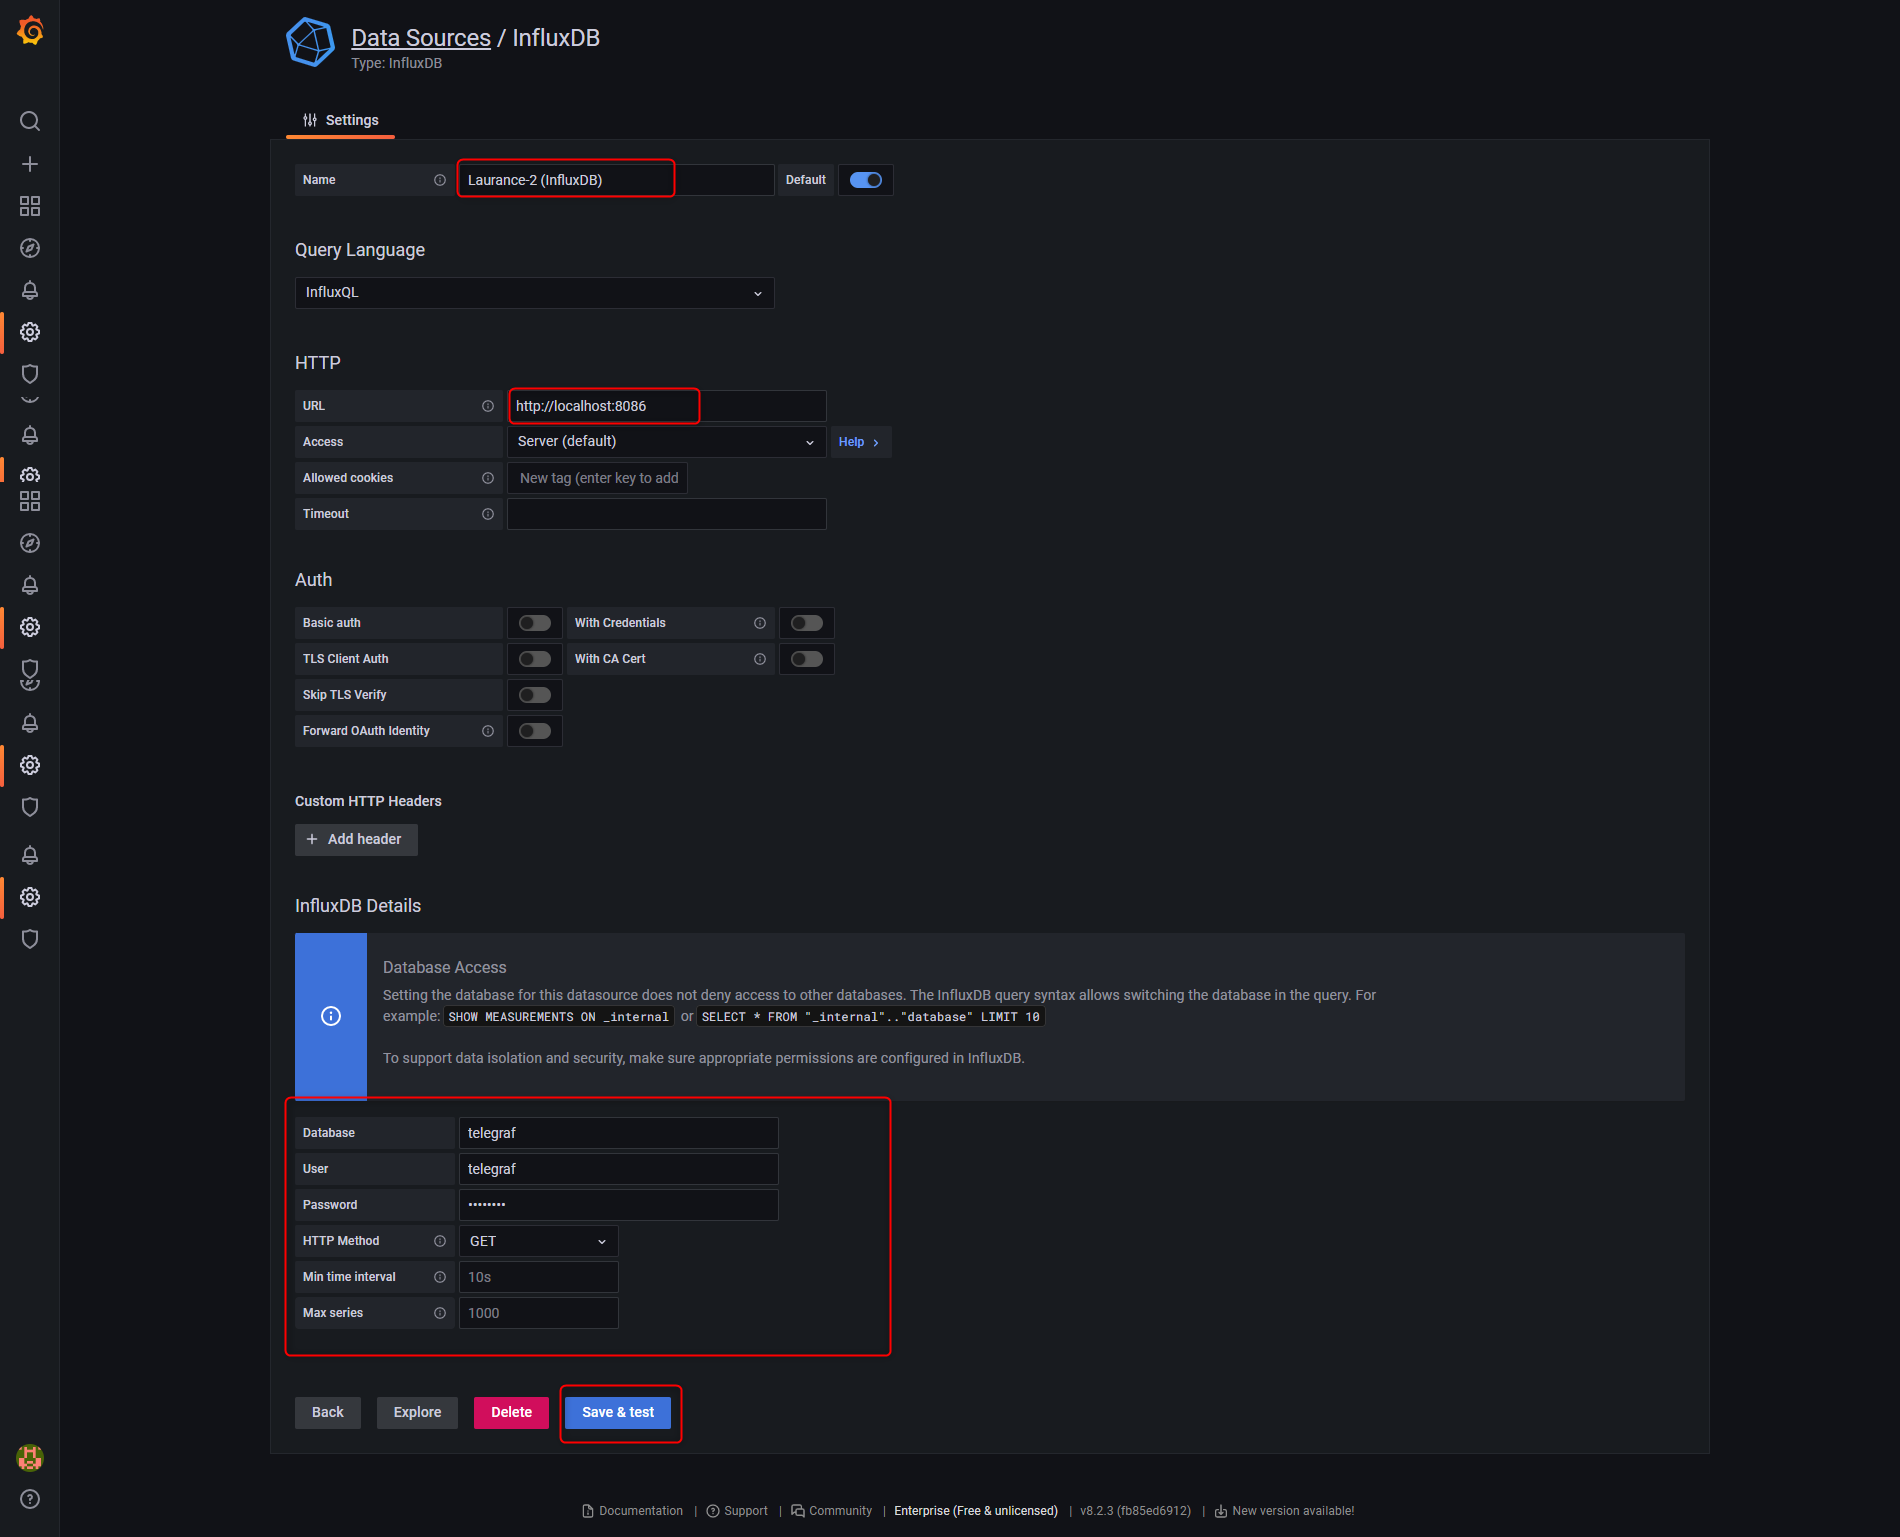
[[outputs.influxdb]]
  urls: ["http://127.0.0.1:8086"]
  database: "telegraf"
  username: "telegraf"
  password: "telegraf"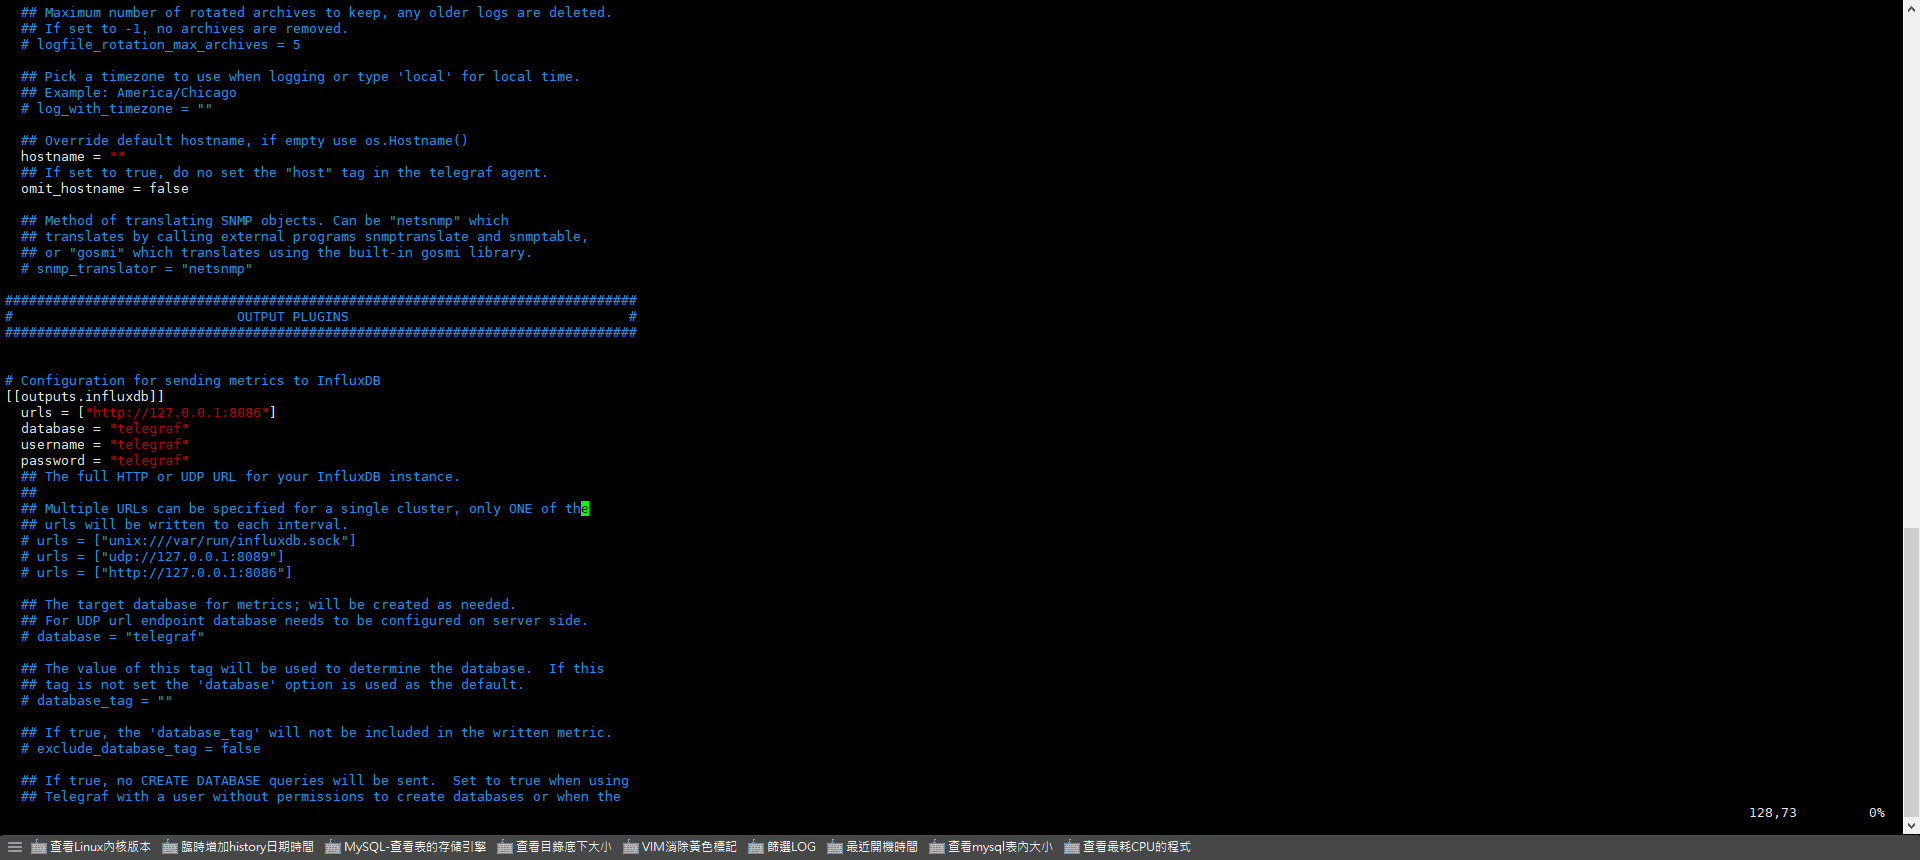
啟動服務 telegraf
service telegraf startStep.2 啟動服務 InfluxDB
service influxdb start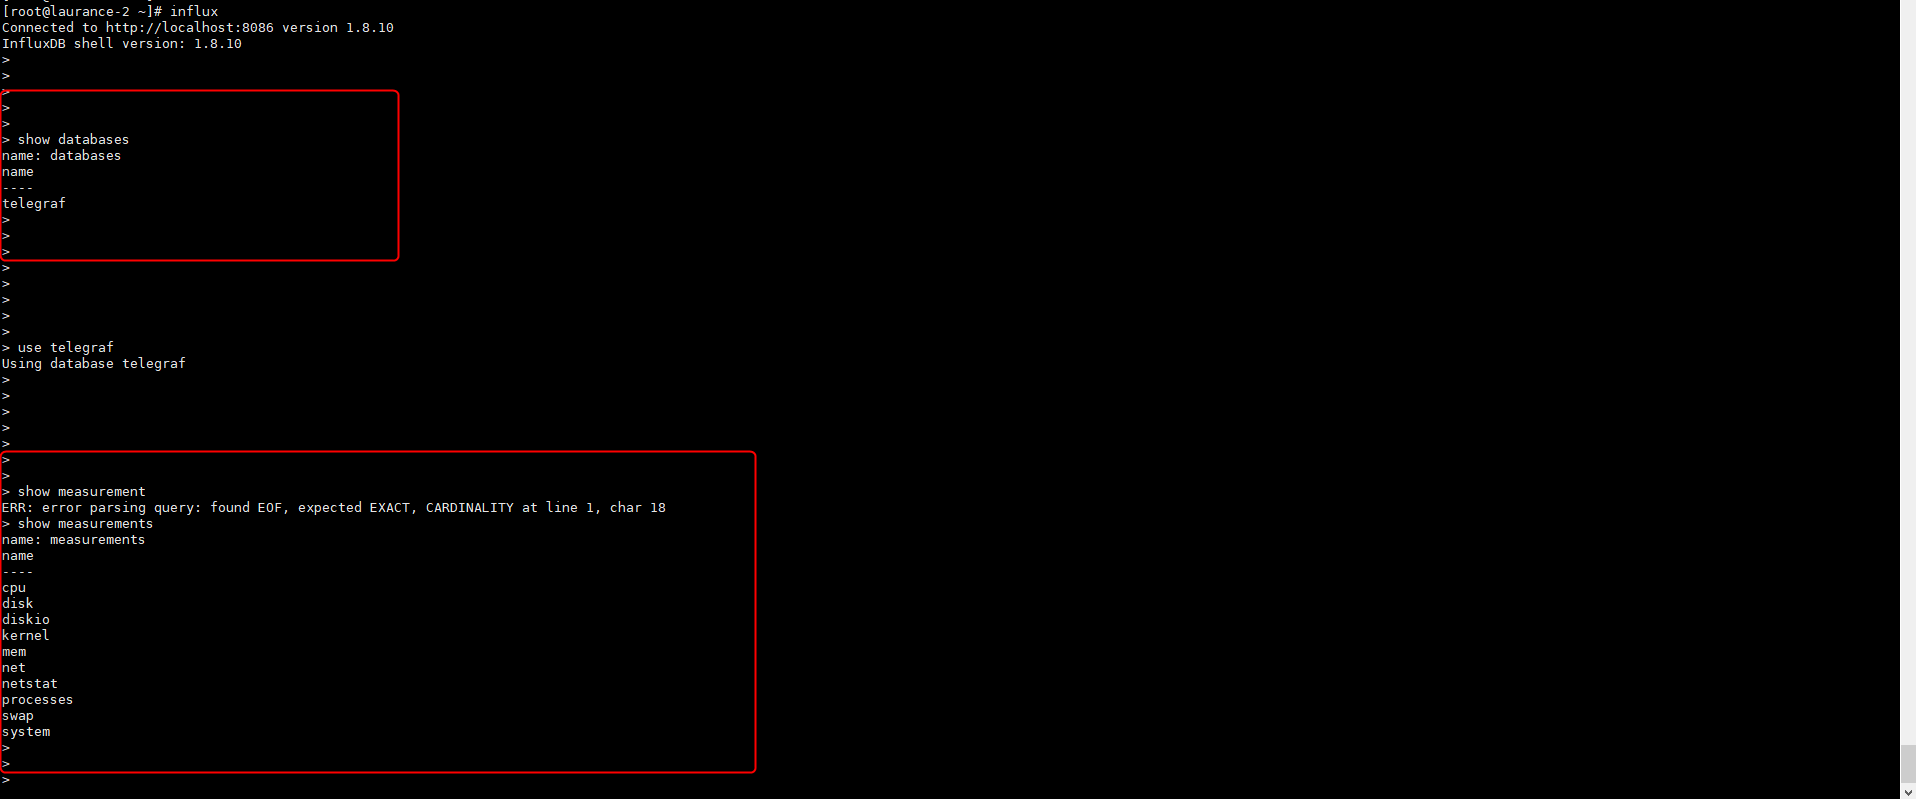
Step.3 進入 InfluxDB 介面建立 telegraf 使用者 , 並給予權限
influx

create user laurance with password [REDACTED]   # 先建立一個 root 身分 , 後續才能使用密碼驗證登入
grant all privileges to laurance

create database telegraf
create user telegraf with password 'telegraf'
grant all on telegraf to telegraf
exit
Step.4 啟動服務 grafana
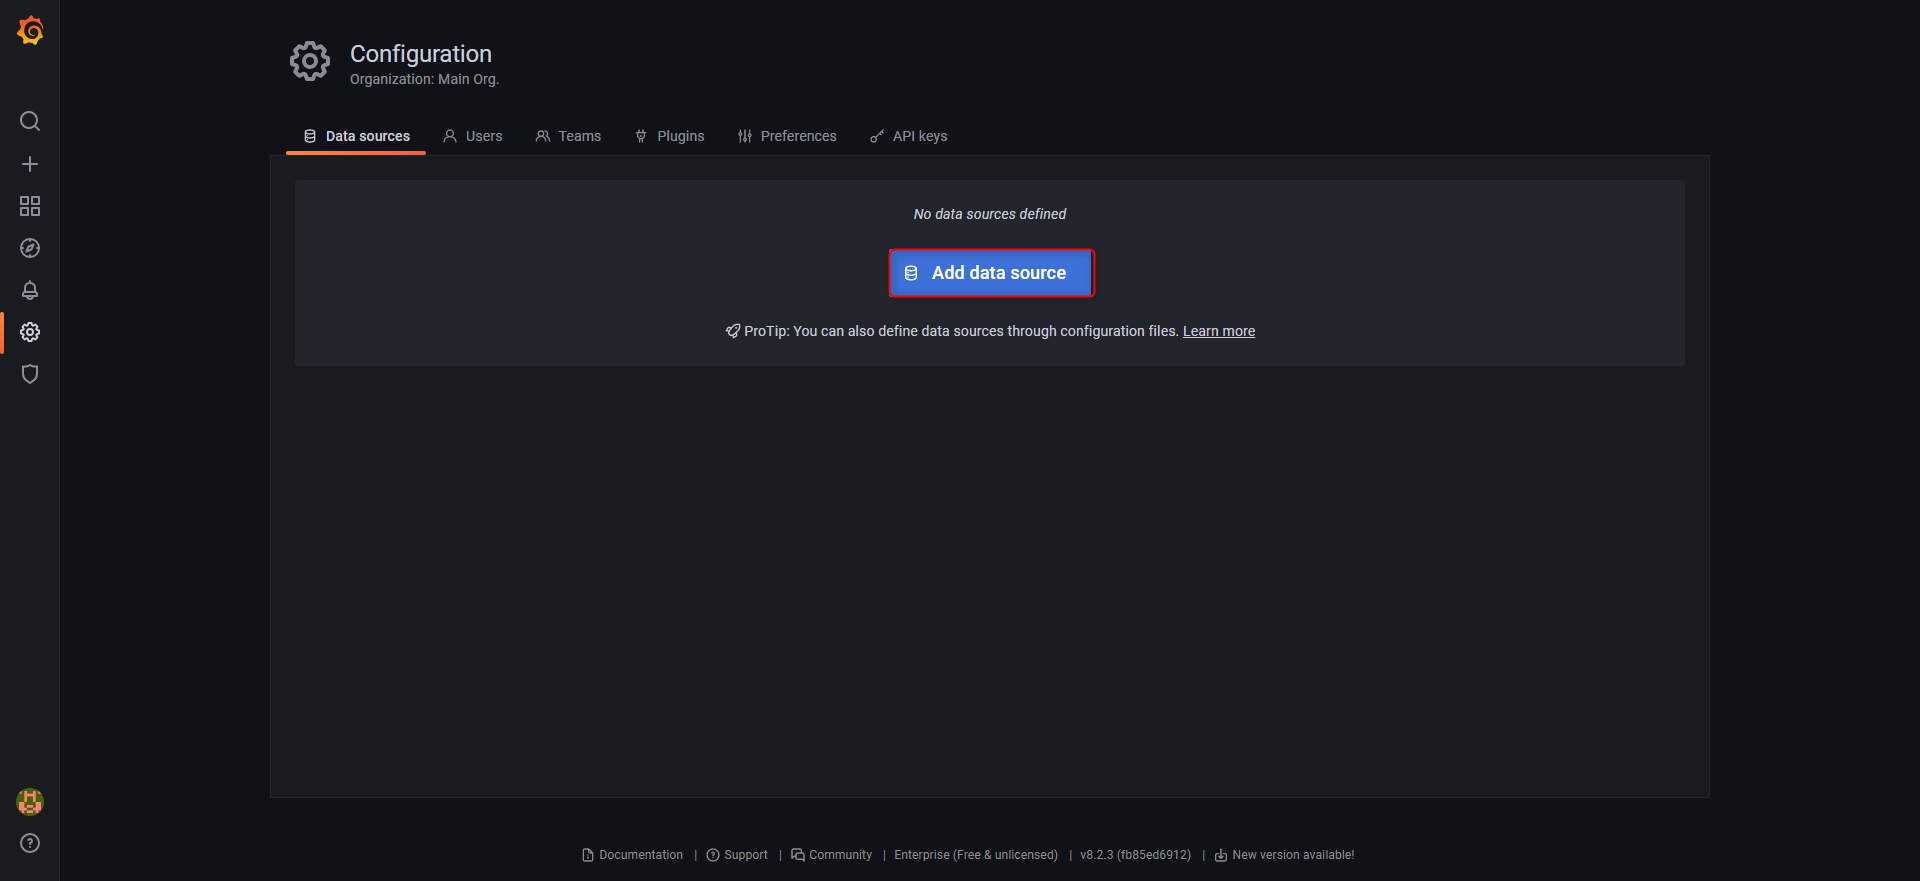
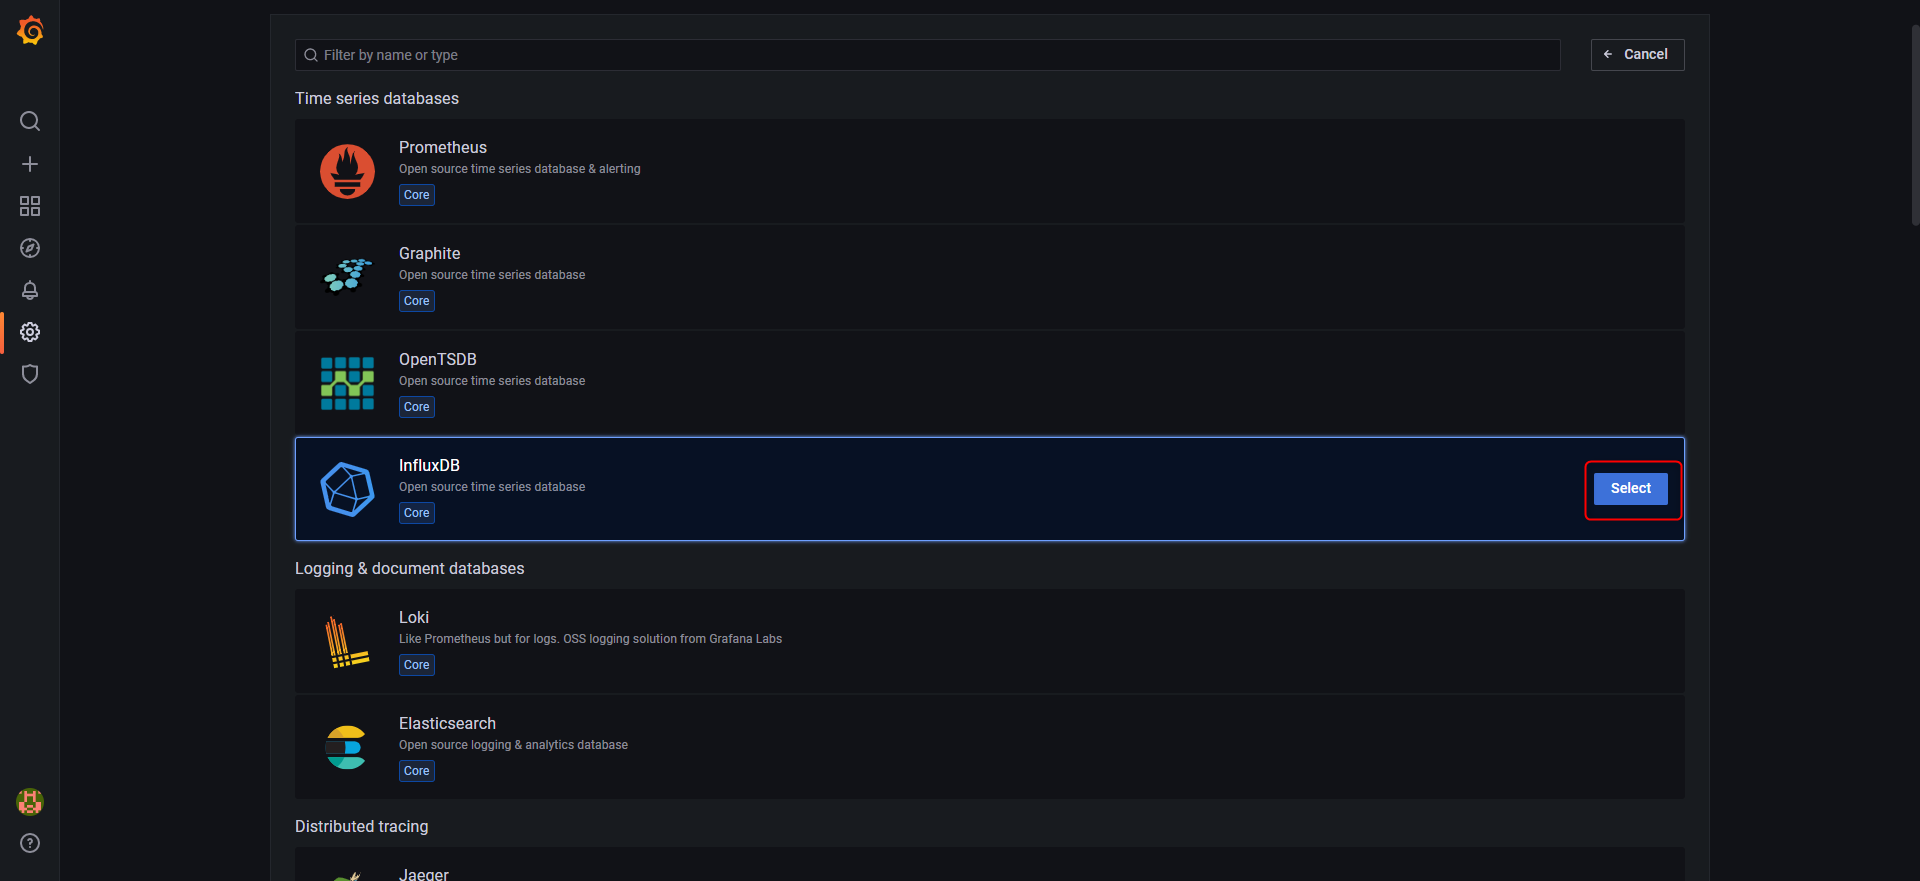
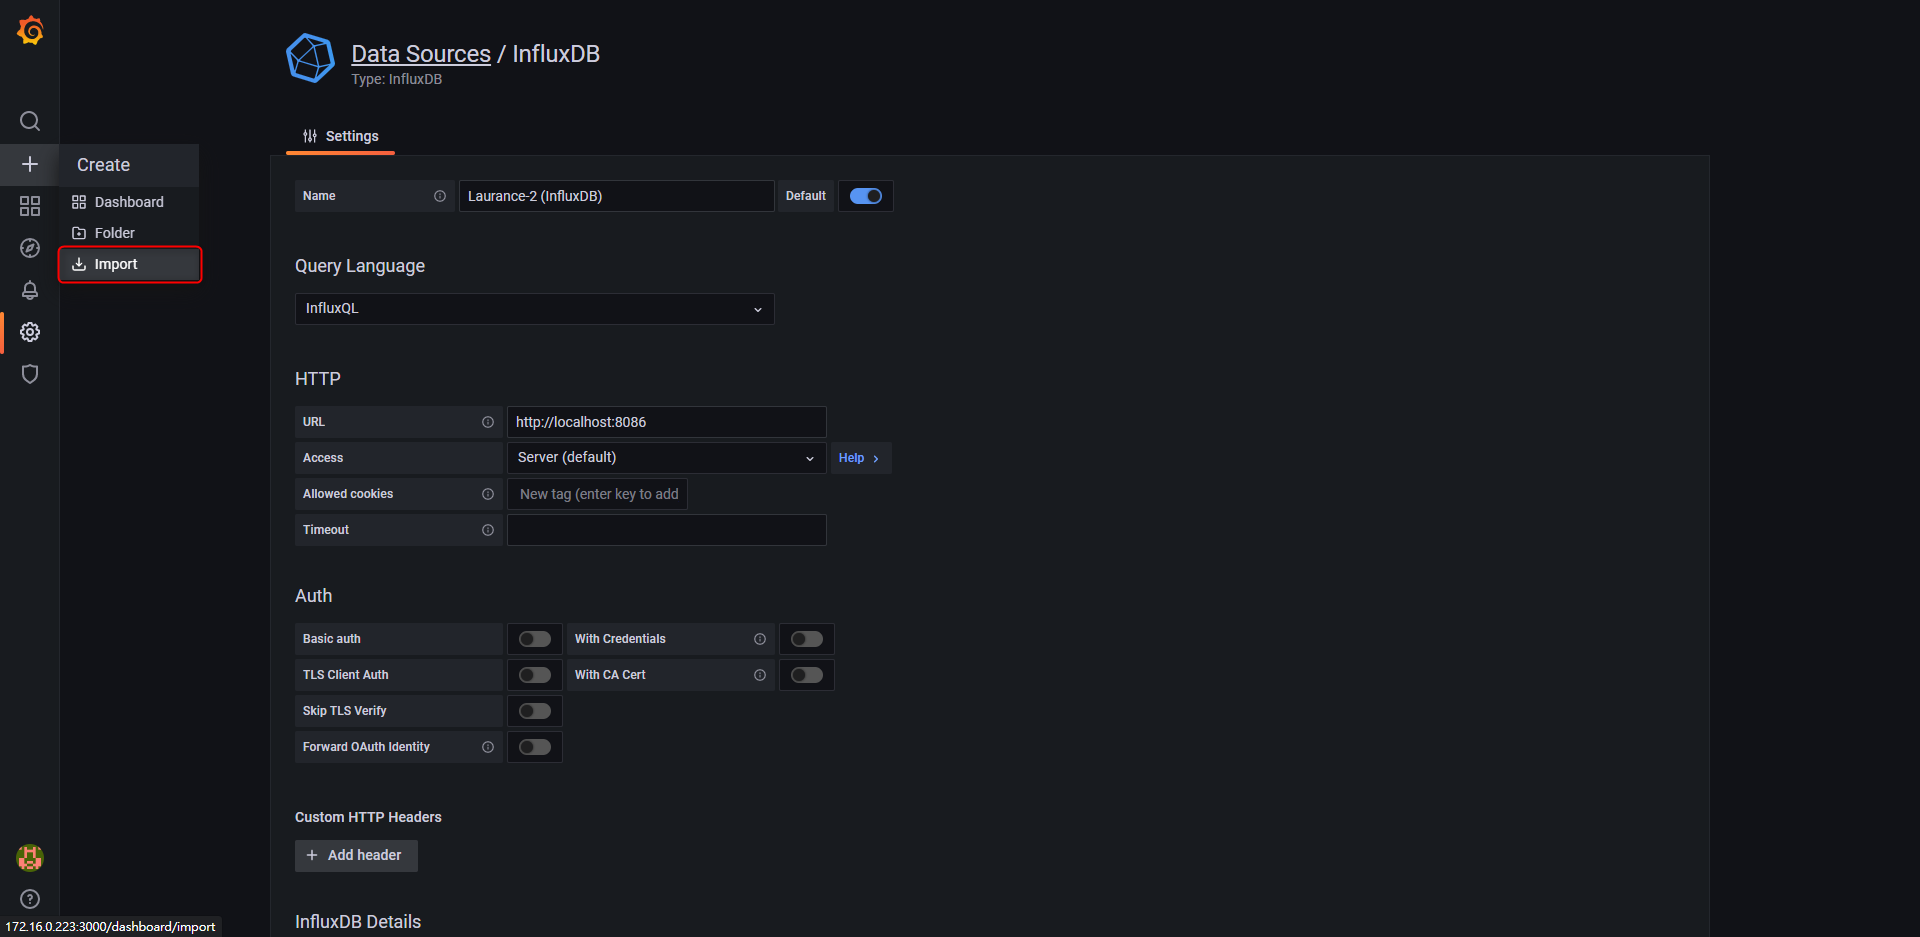
systemctl start grafana-serverStep.5 開啟後台 http://localhost:3000 並建立資料來源 datasource
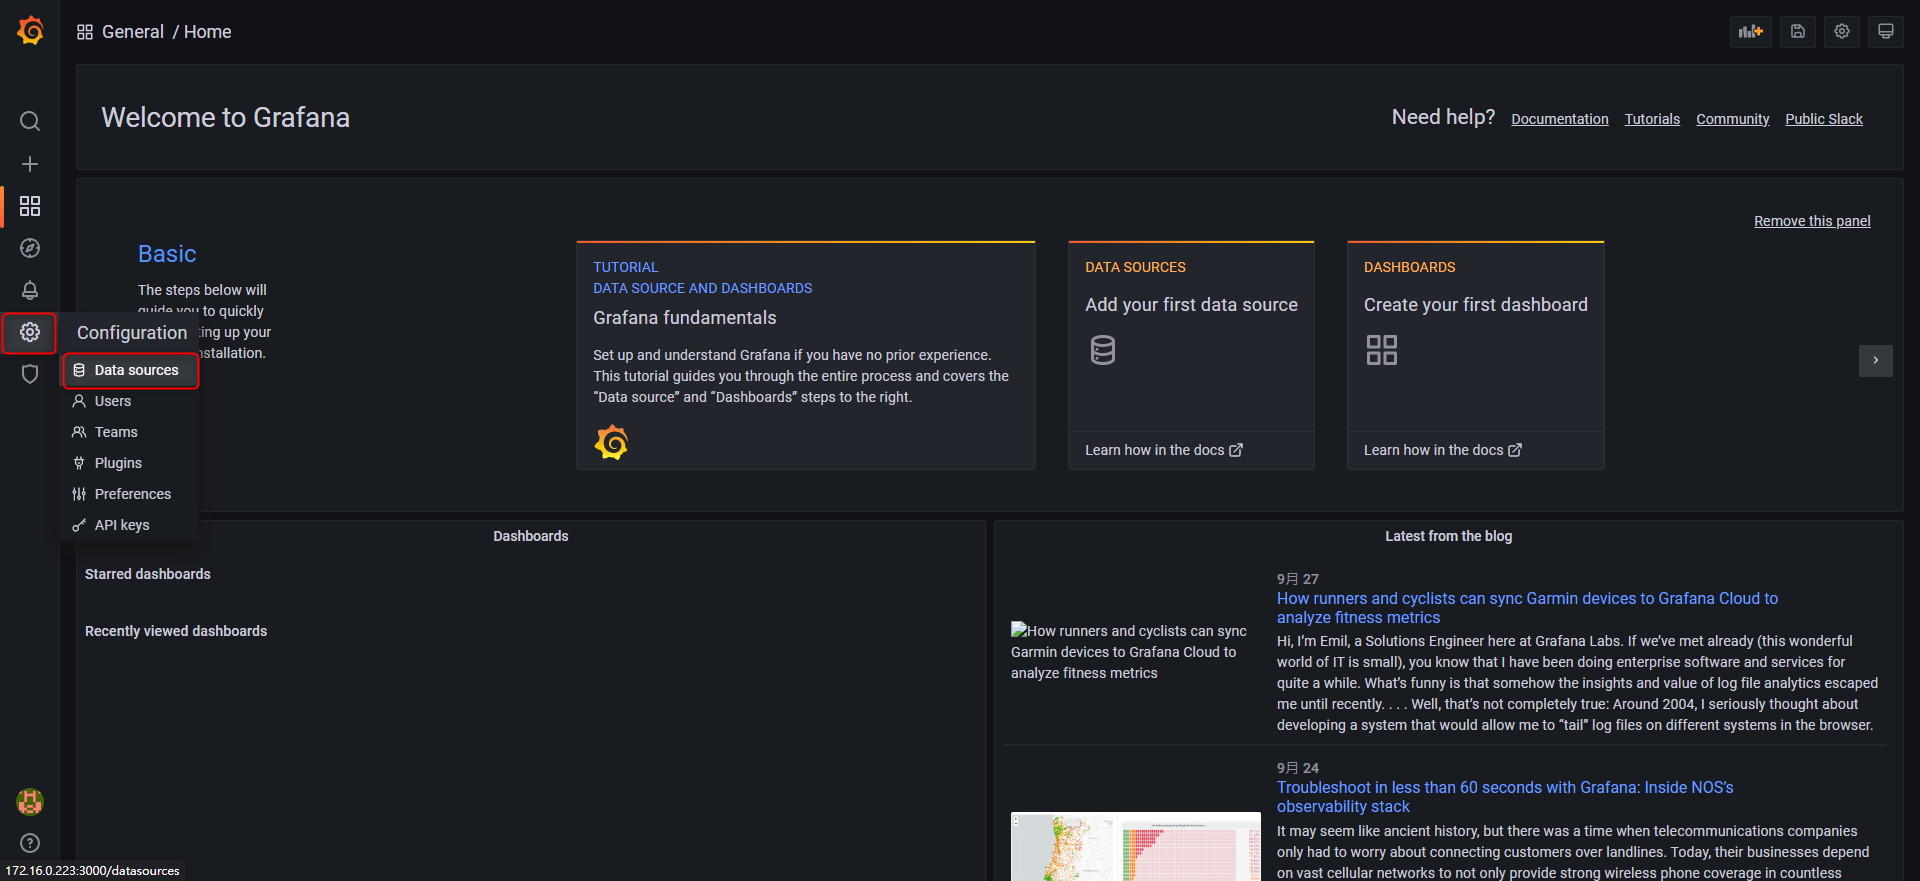
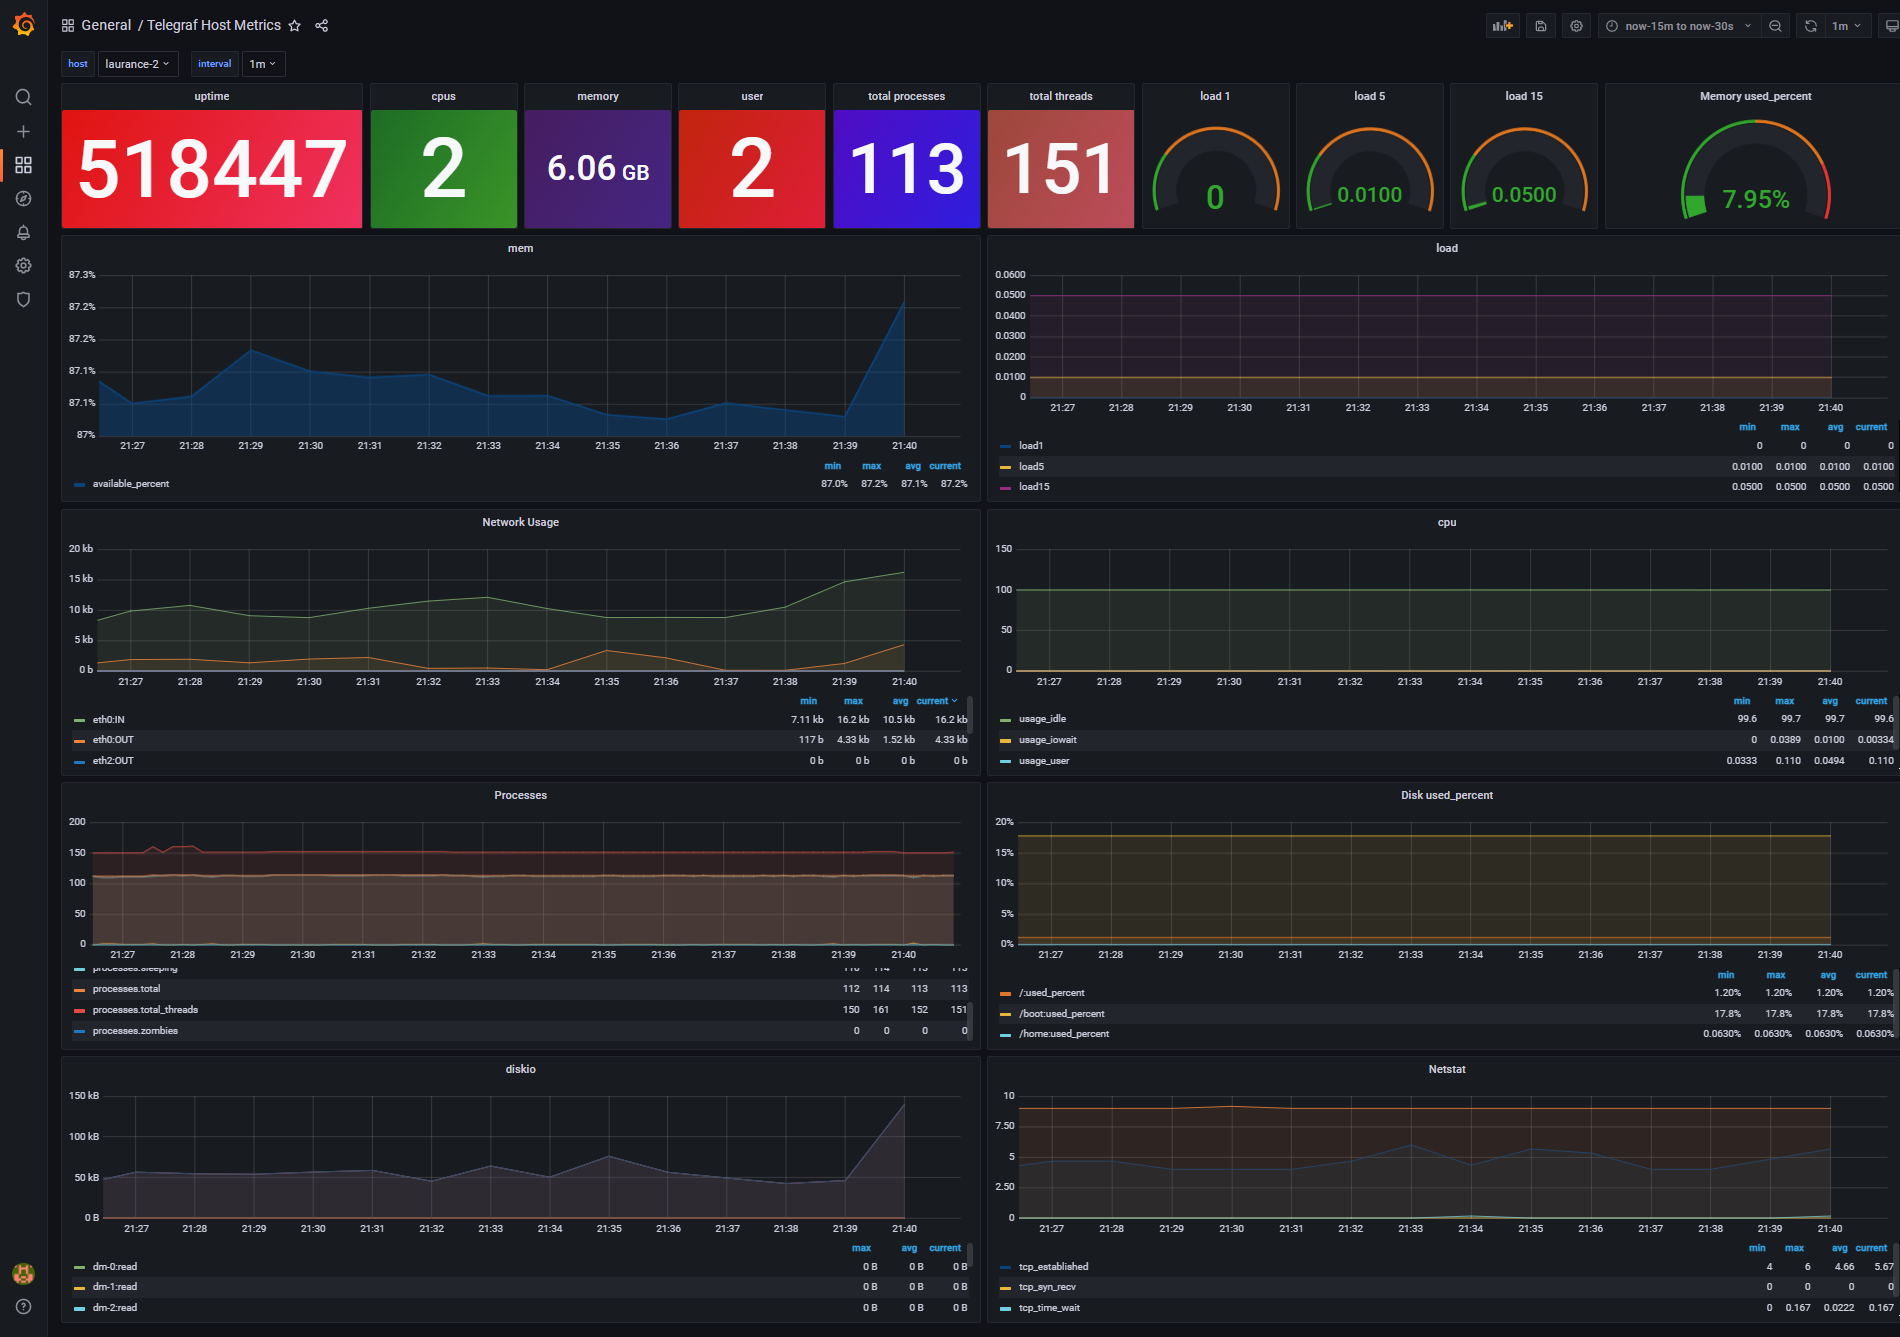
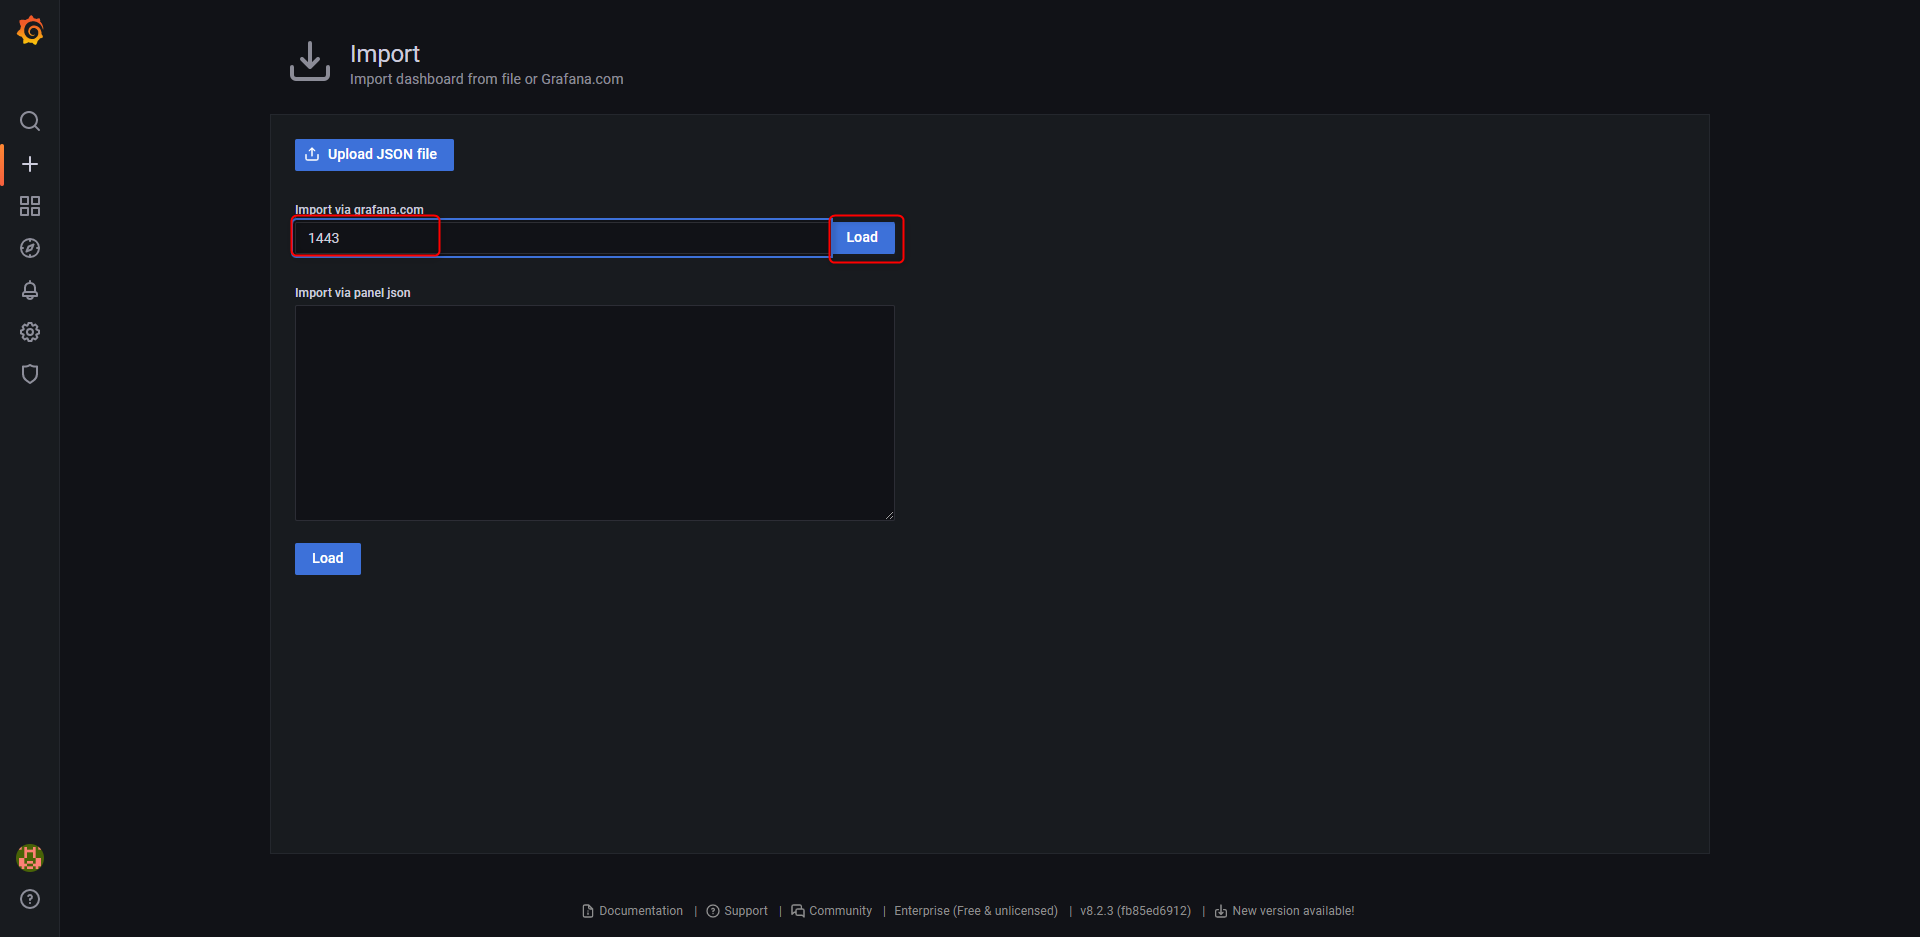
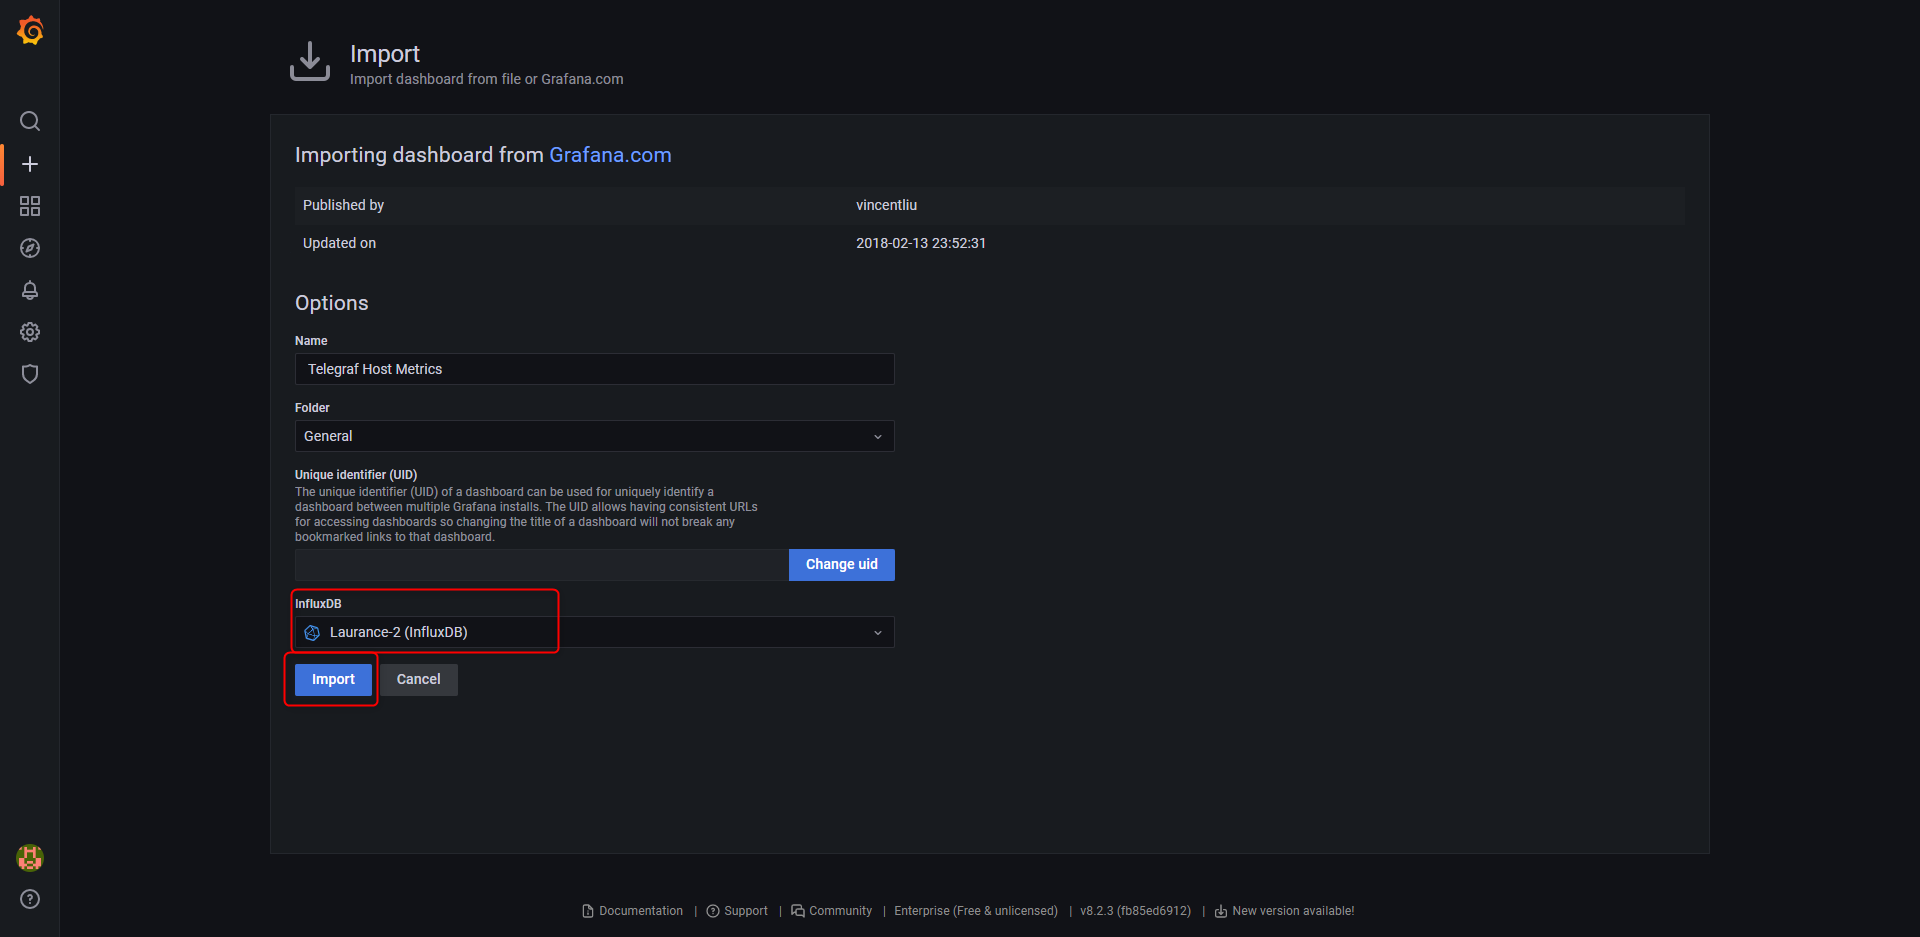
Step.6 匯入 Grafana 官方模板
Step.7 驗證: 打開本機 3000port ex: http://172.16.0.222:3000