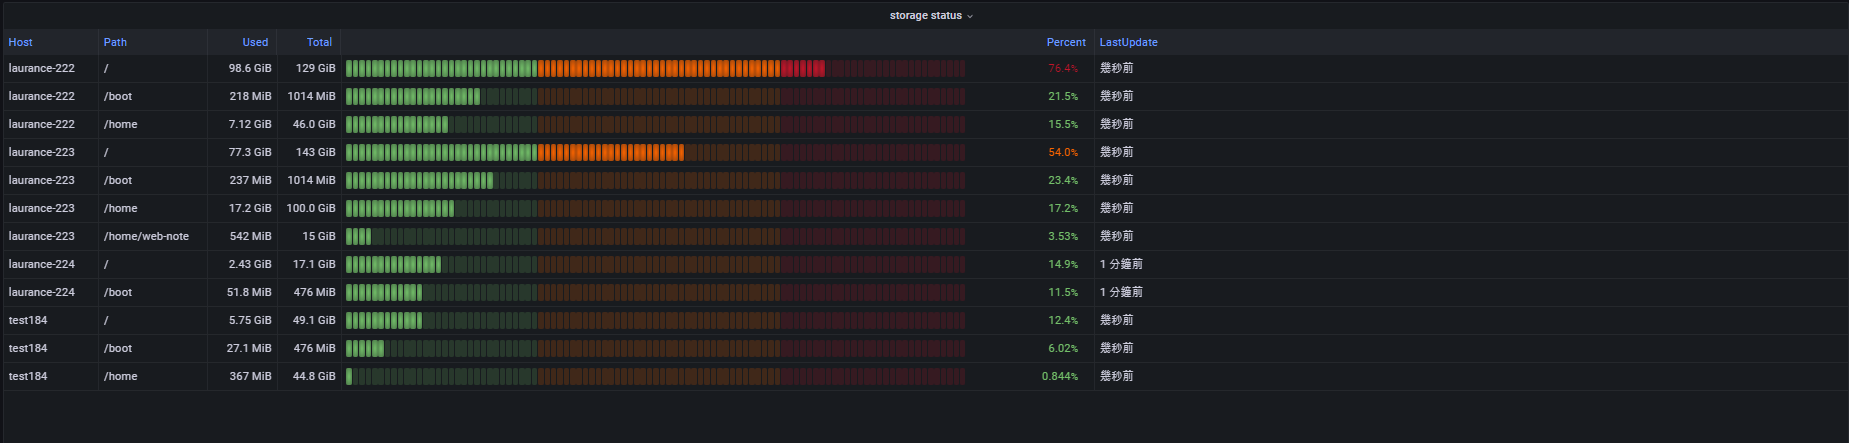
Add an panel for monitor storage
{step1} 右上角 + > Add an empty panel
{step2} 依需求填寫 Data source Query Visualization
Data source: InfluxDB
Format as: Table
Visualization: Table
SELECT last("used_percent") AS "percent", "used" AS "used", "total" AS "total" FROM "disk" WHERE "host" !~ /^$interval$/ and time > now() -1m group by "host", "path"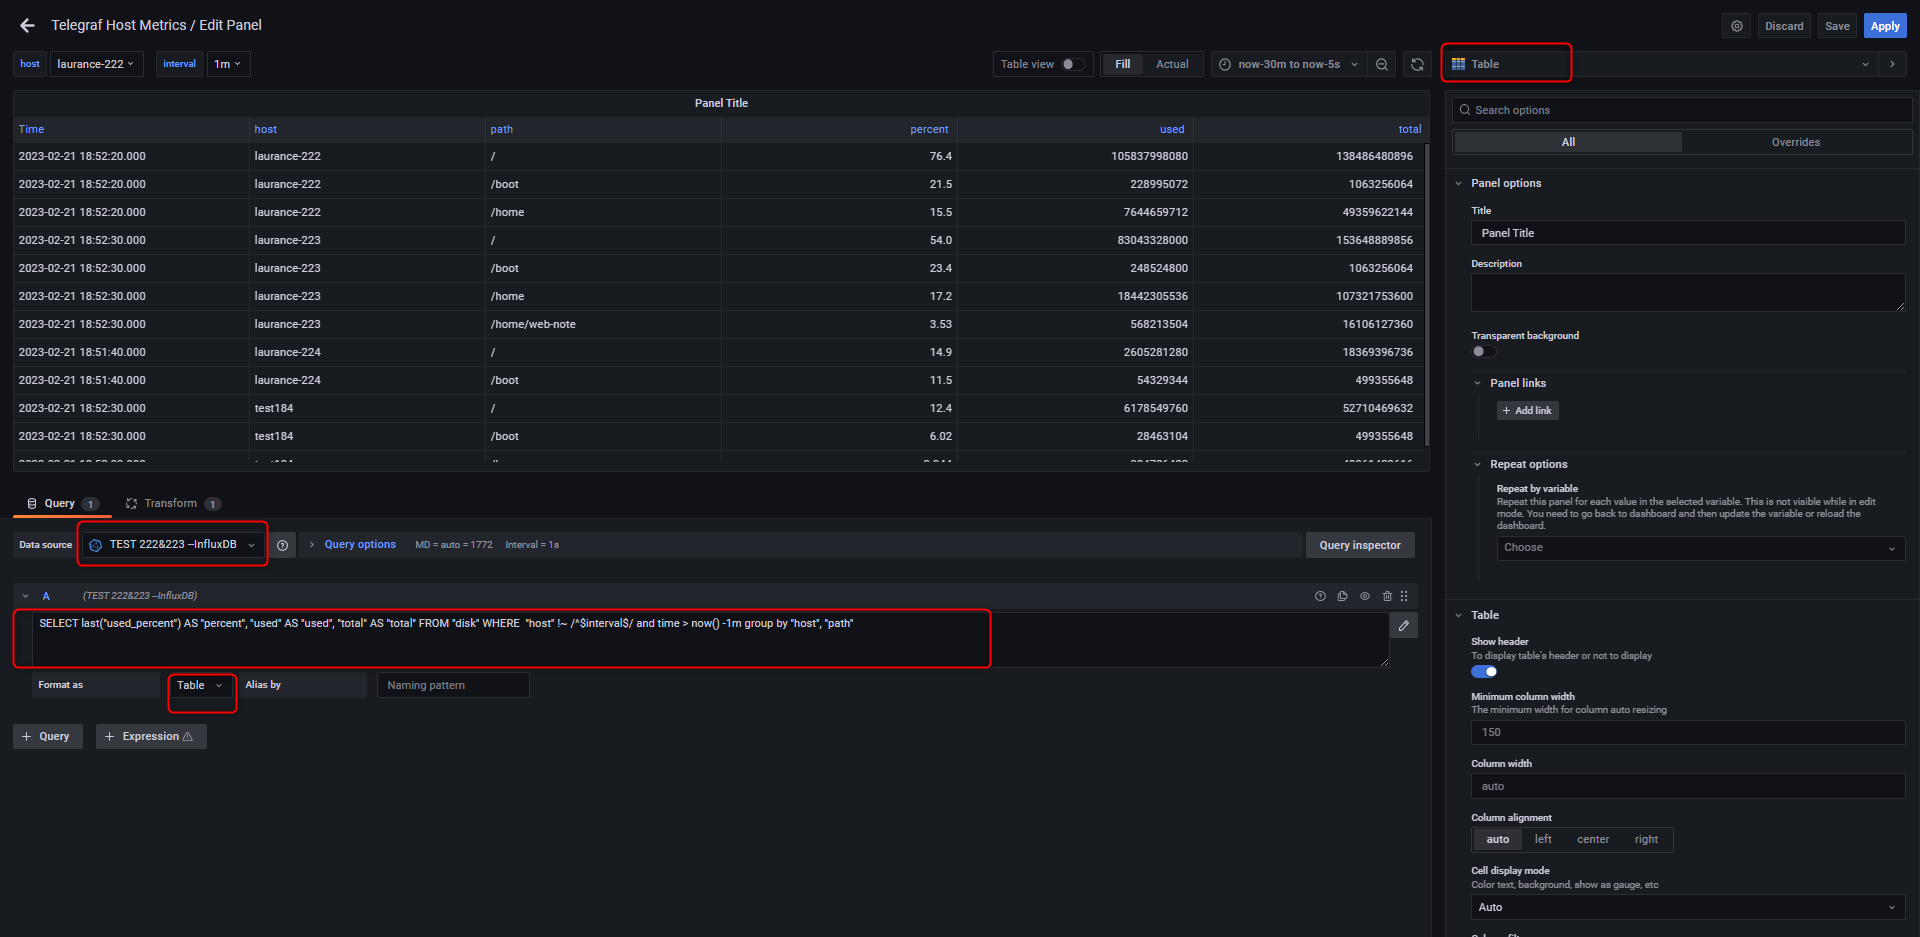
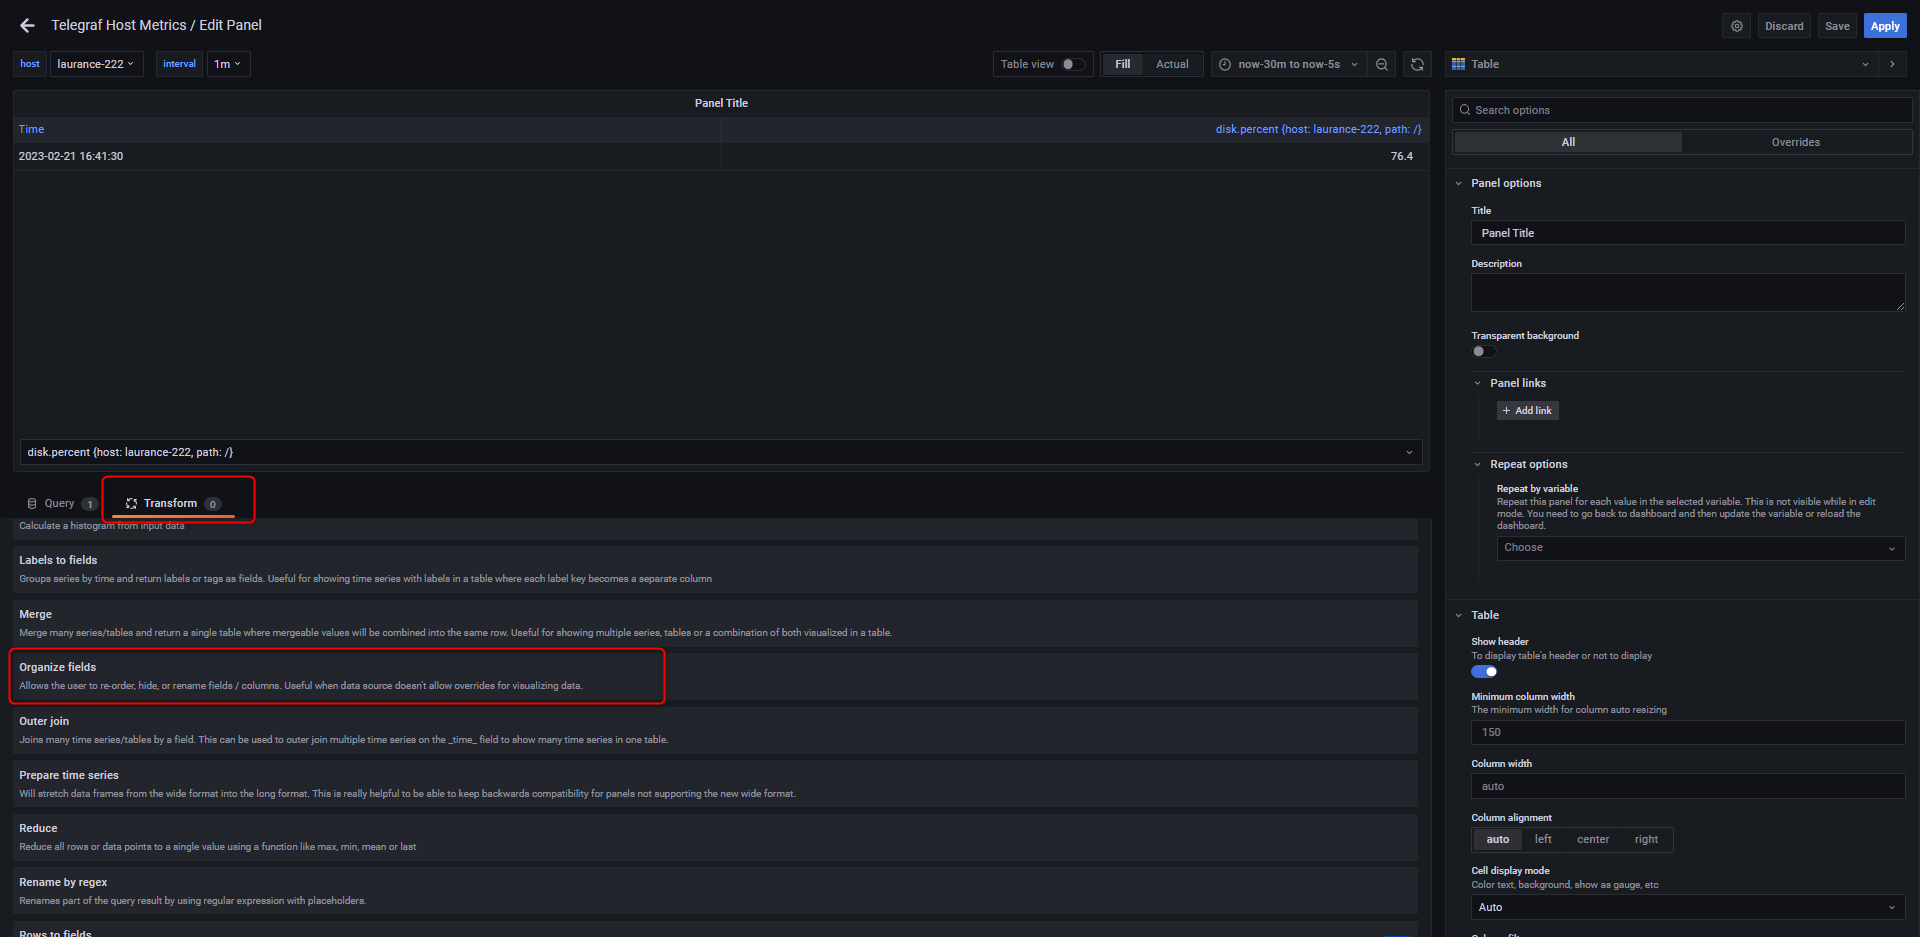
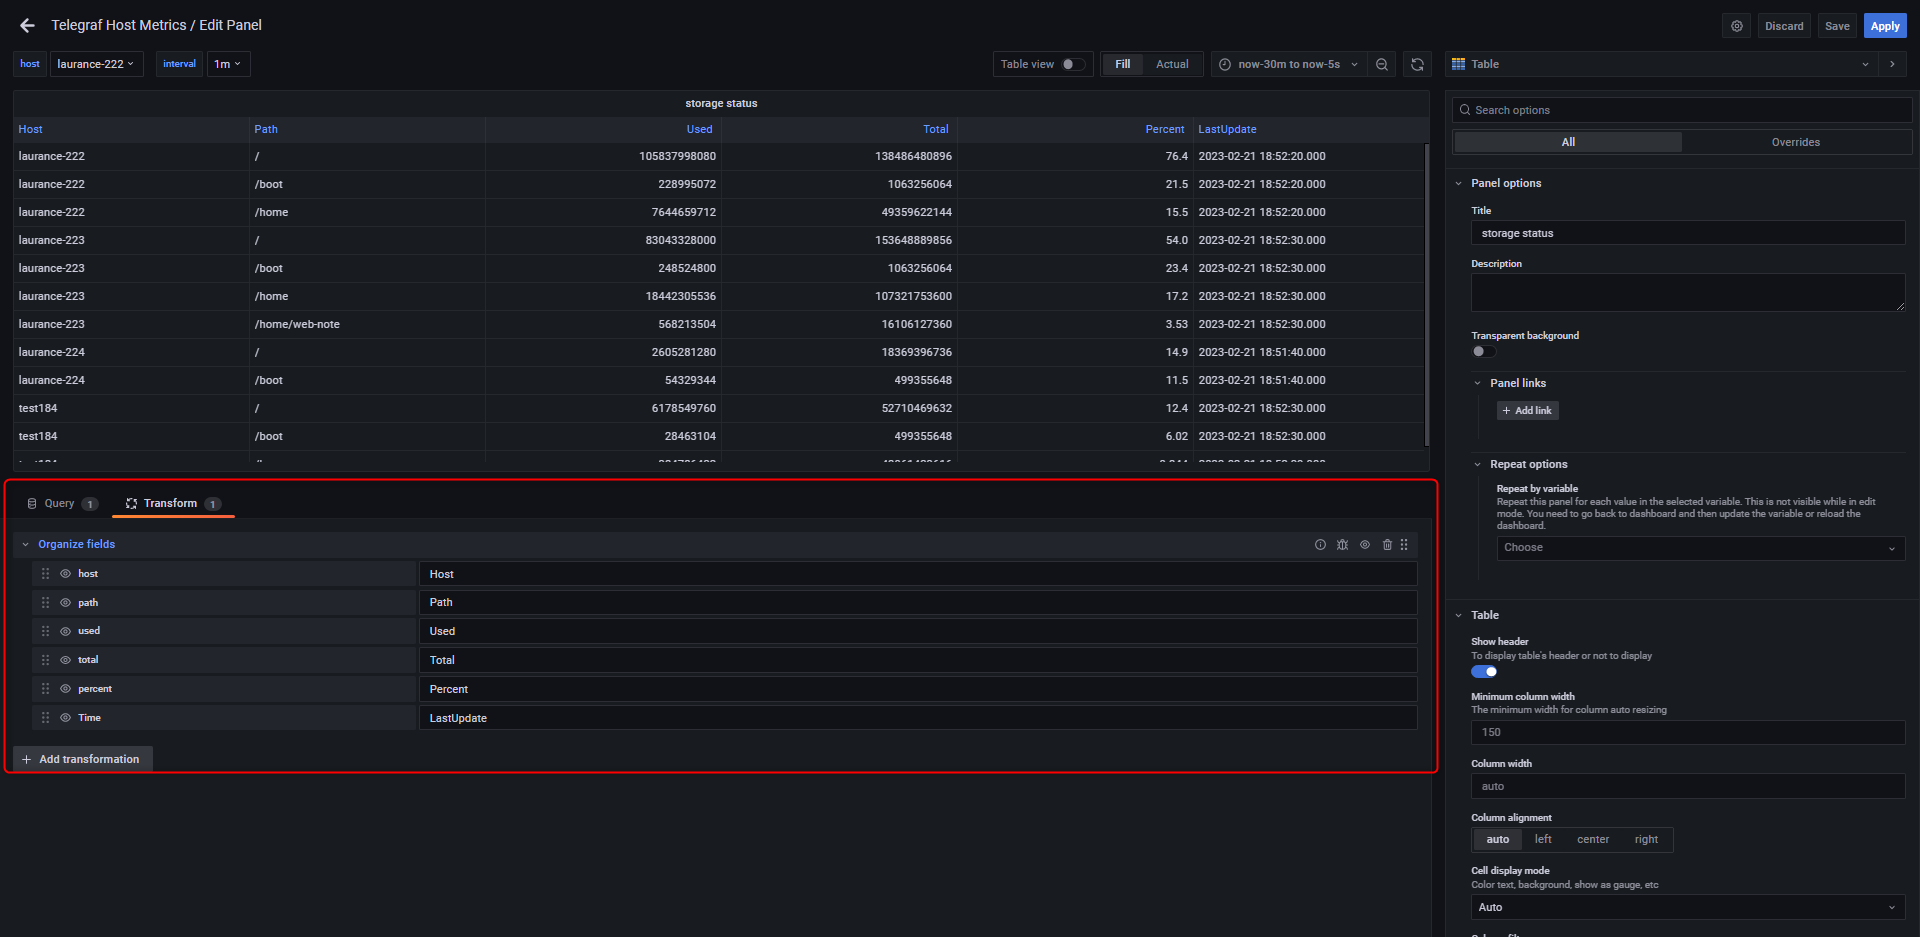
{step3} 選擇 Transform 建立 Organize fields && 依需求填寫 host,path,used,total,percent,lastupdate
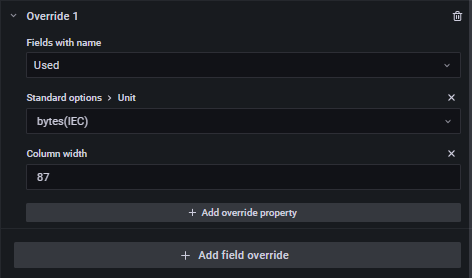
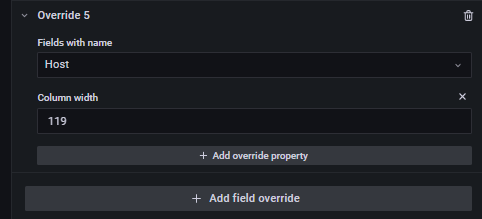
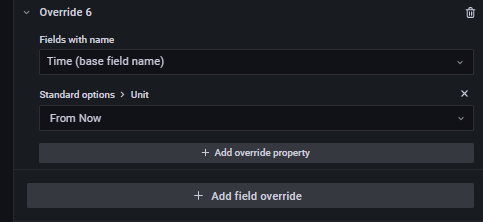
{step4} 右側條件選單拉到最底選擇 Add filed override
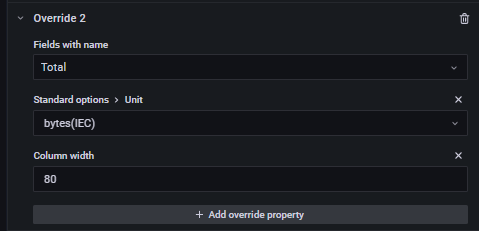
Override 1 & Override 2
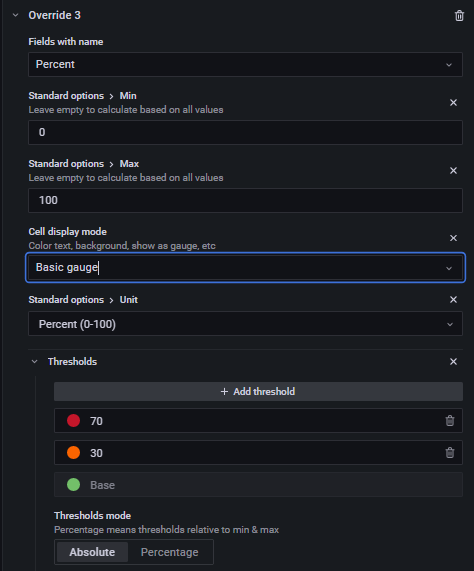
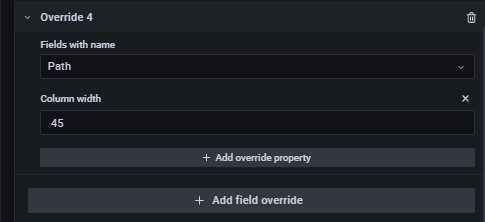
Override 3 & Override 4
Override 5 & Override 6
FINAL