Add an panel for monitor memory
{step1} 右上角 + > Add an empty panel
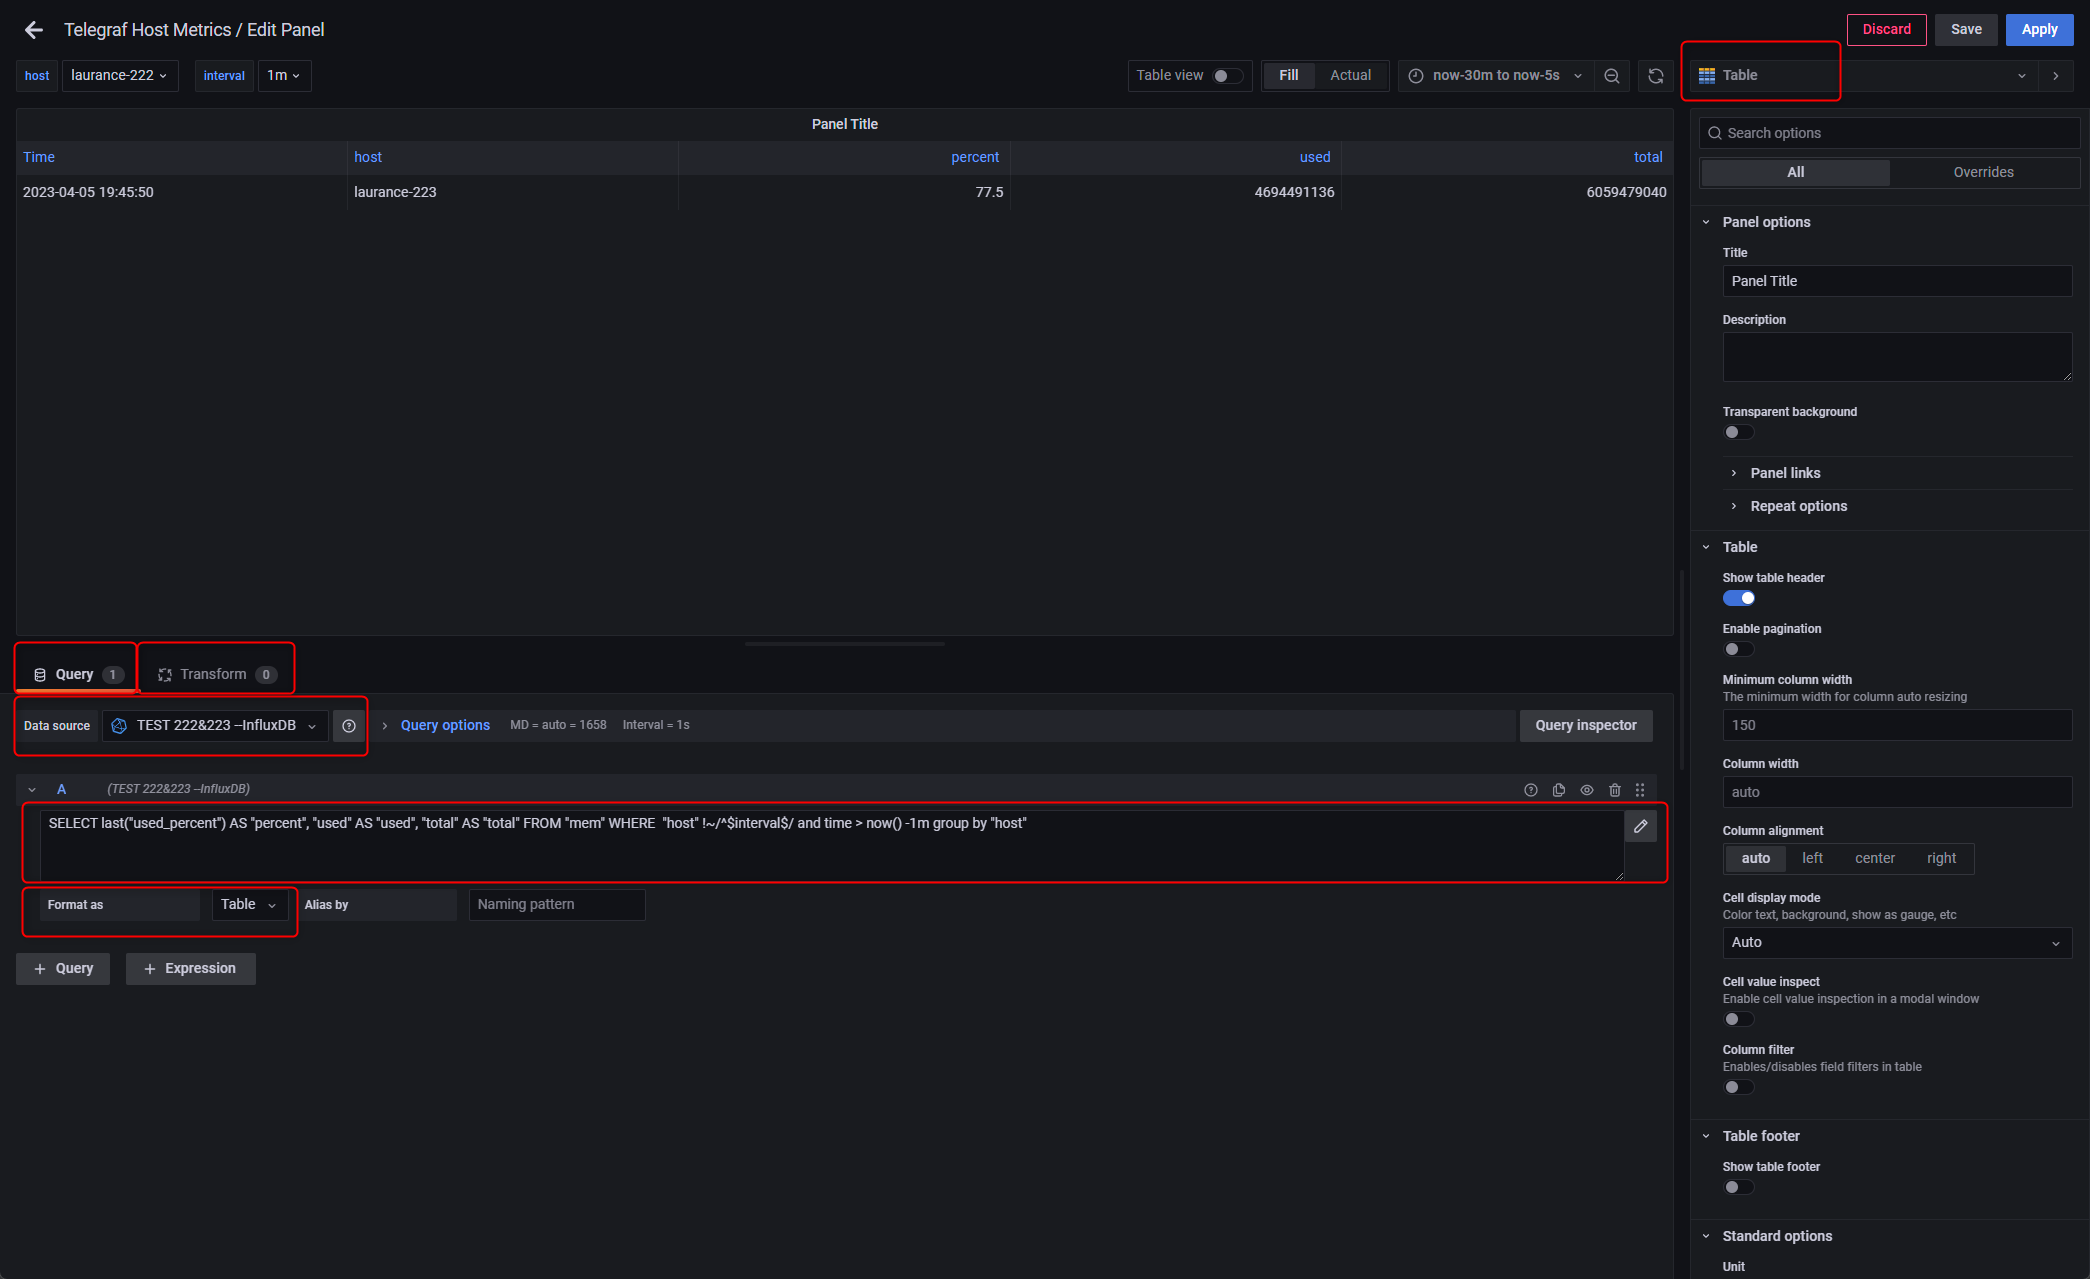
{step2} 依需求填寫 Data source Query Visualization
Data source: InfluxDB
Query:
SELECT last(“used_percent”) AS “percent”, “used” AS “used”, “total” AS “total” FROM “mem” WHERE “host” !~/^$interval$/ and time > now() -1m group by “host”
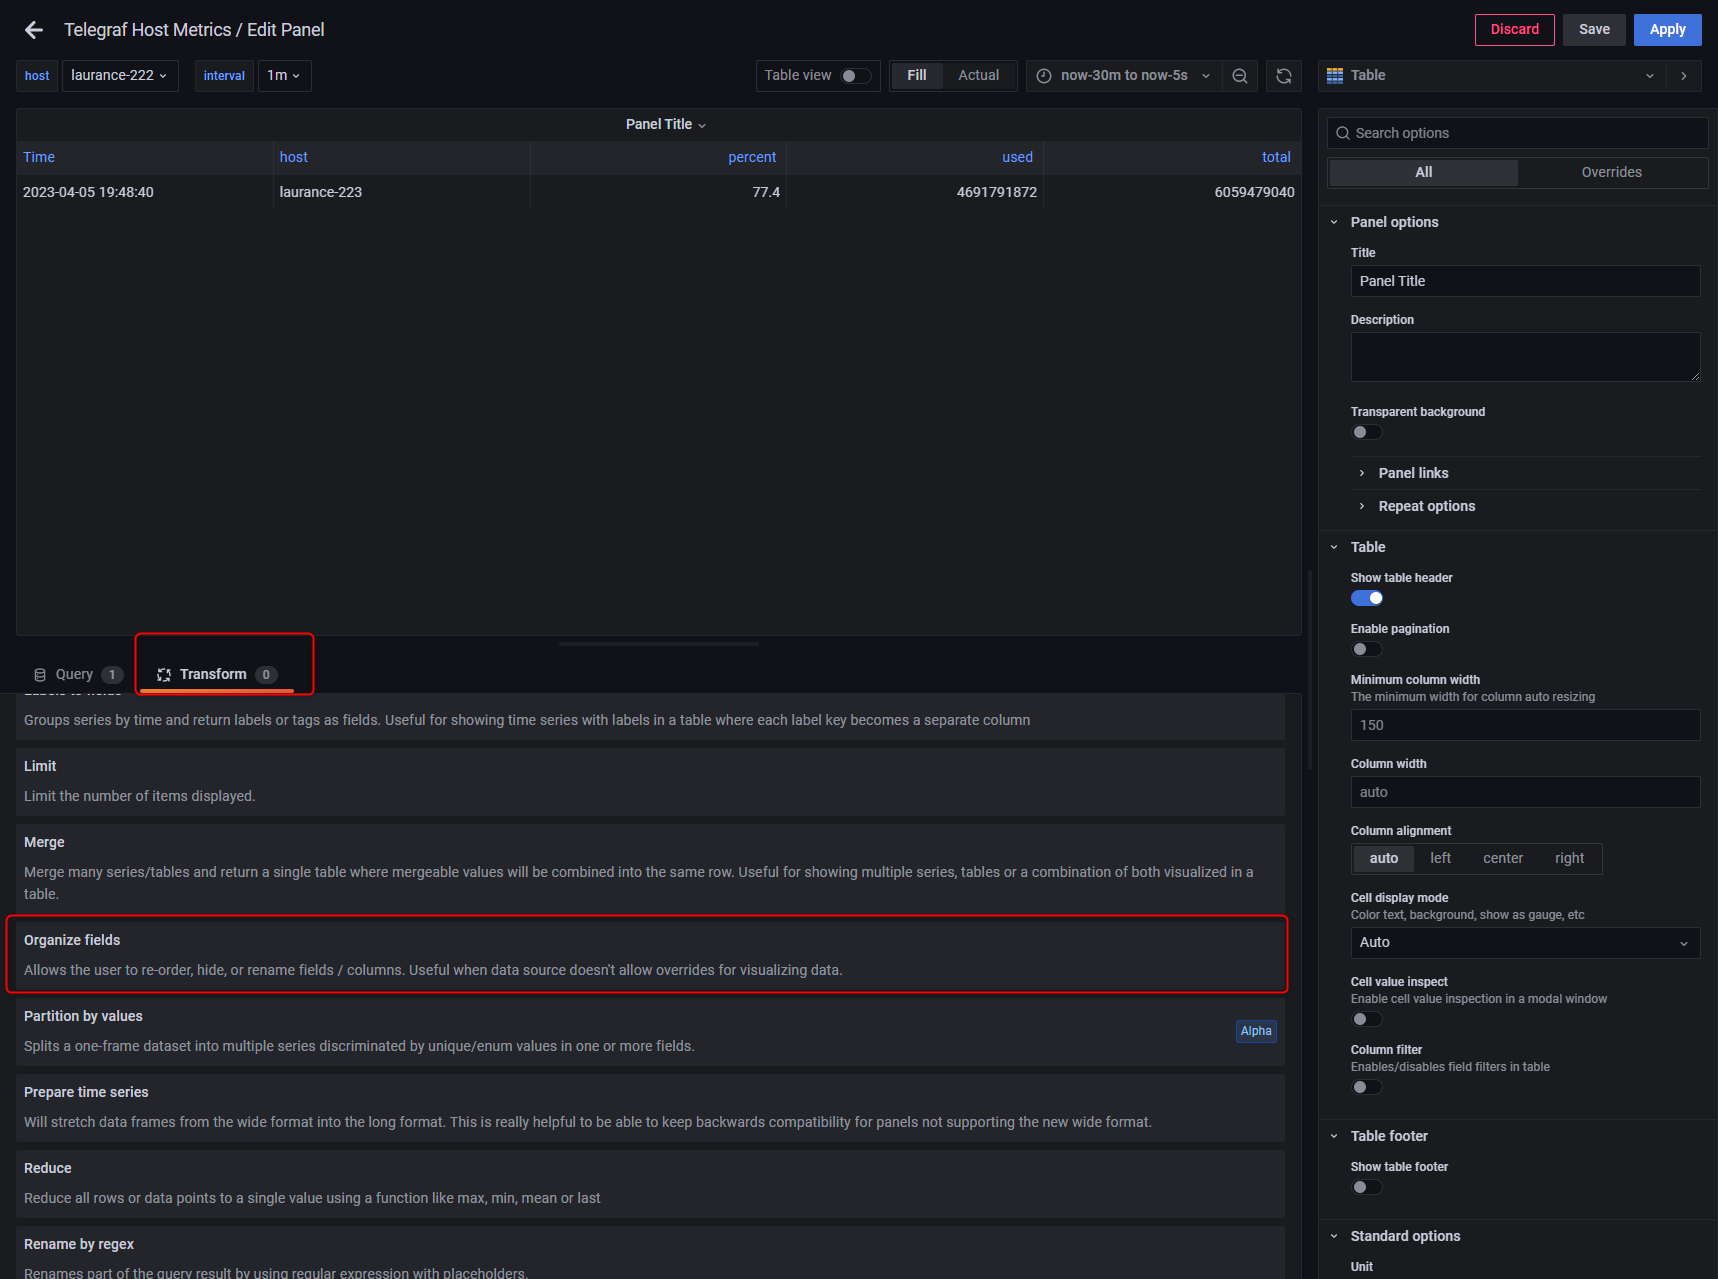
Visualization: Table
{step3} 依需求新增 Transform
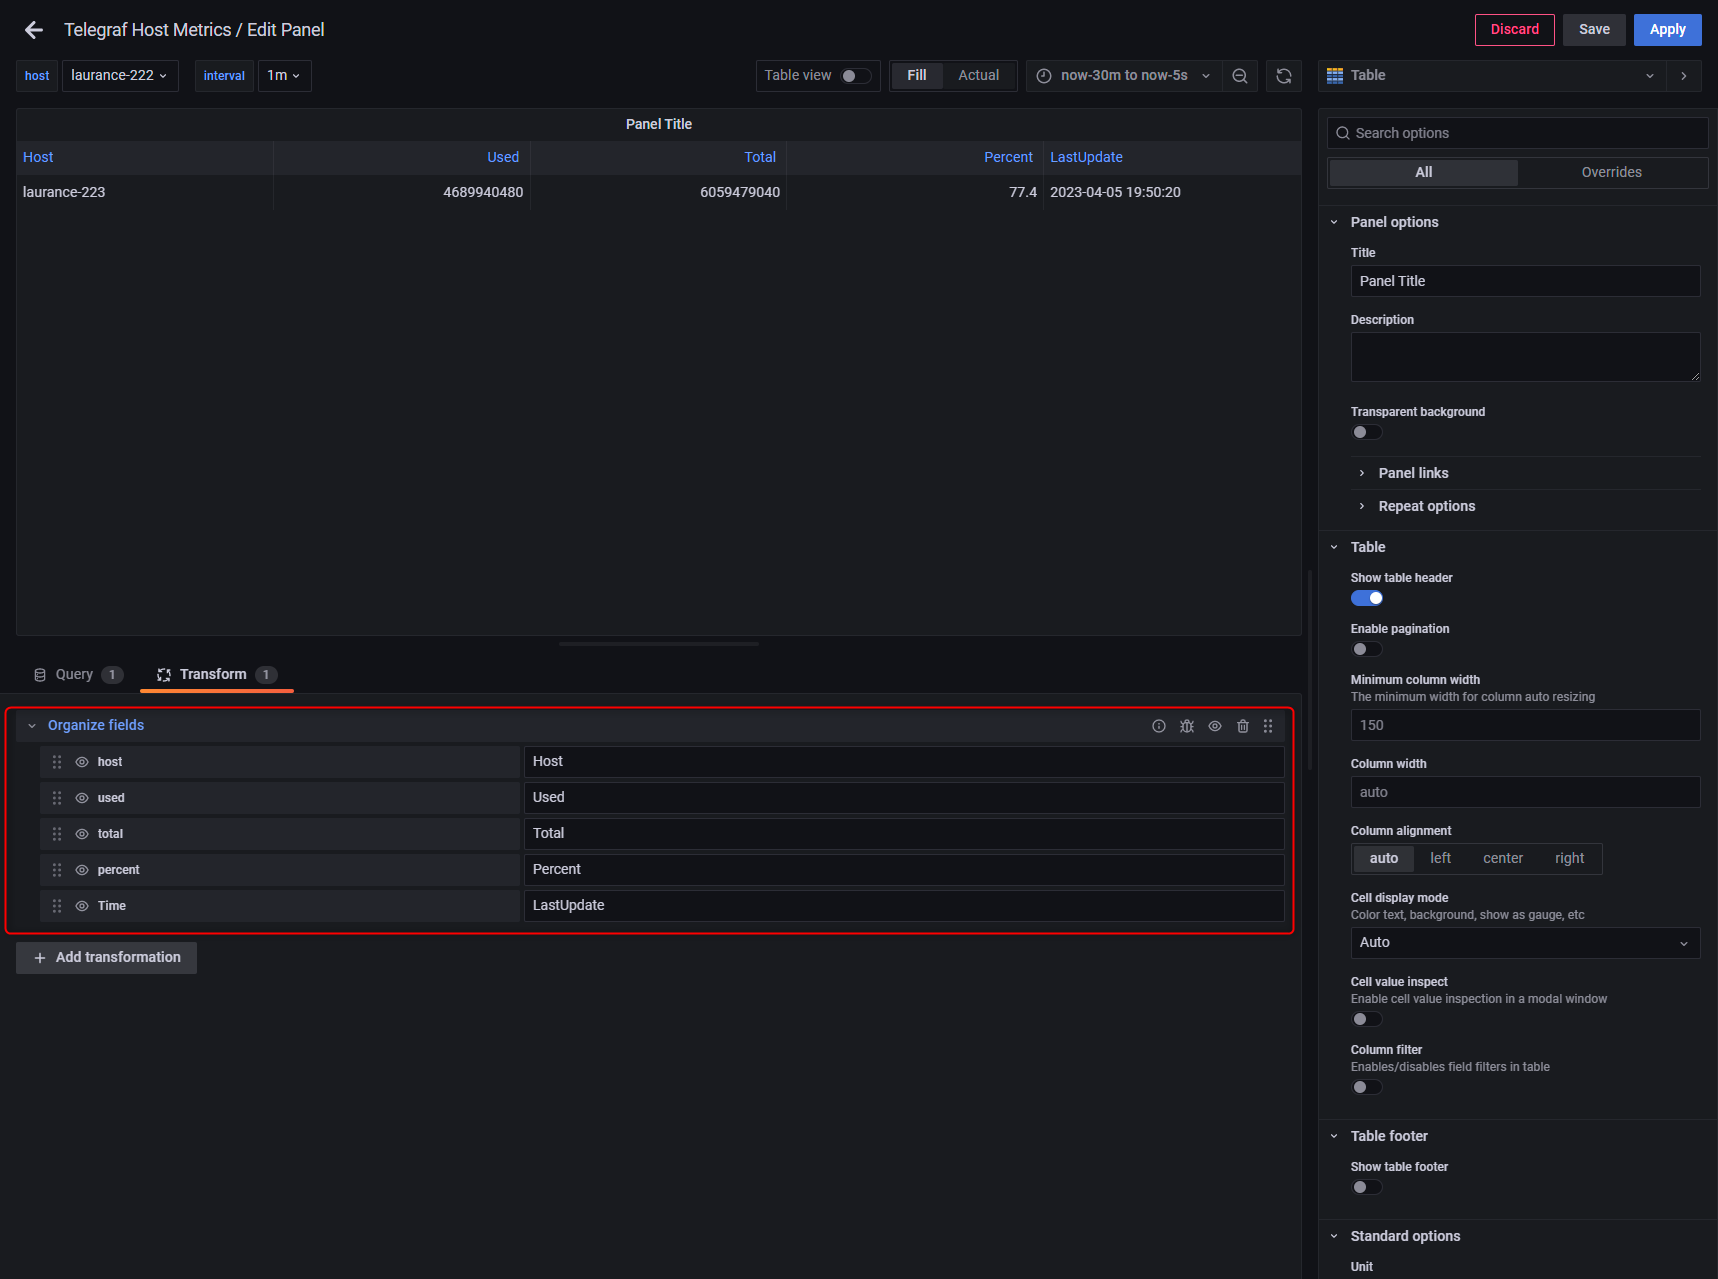
Transform: Organize fields
host: Host
used: Used
total: Total
percent: Percent
Time: LastUpdate
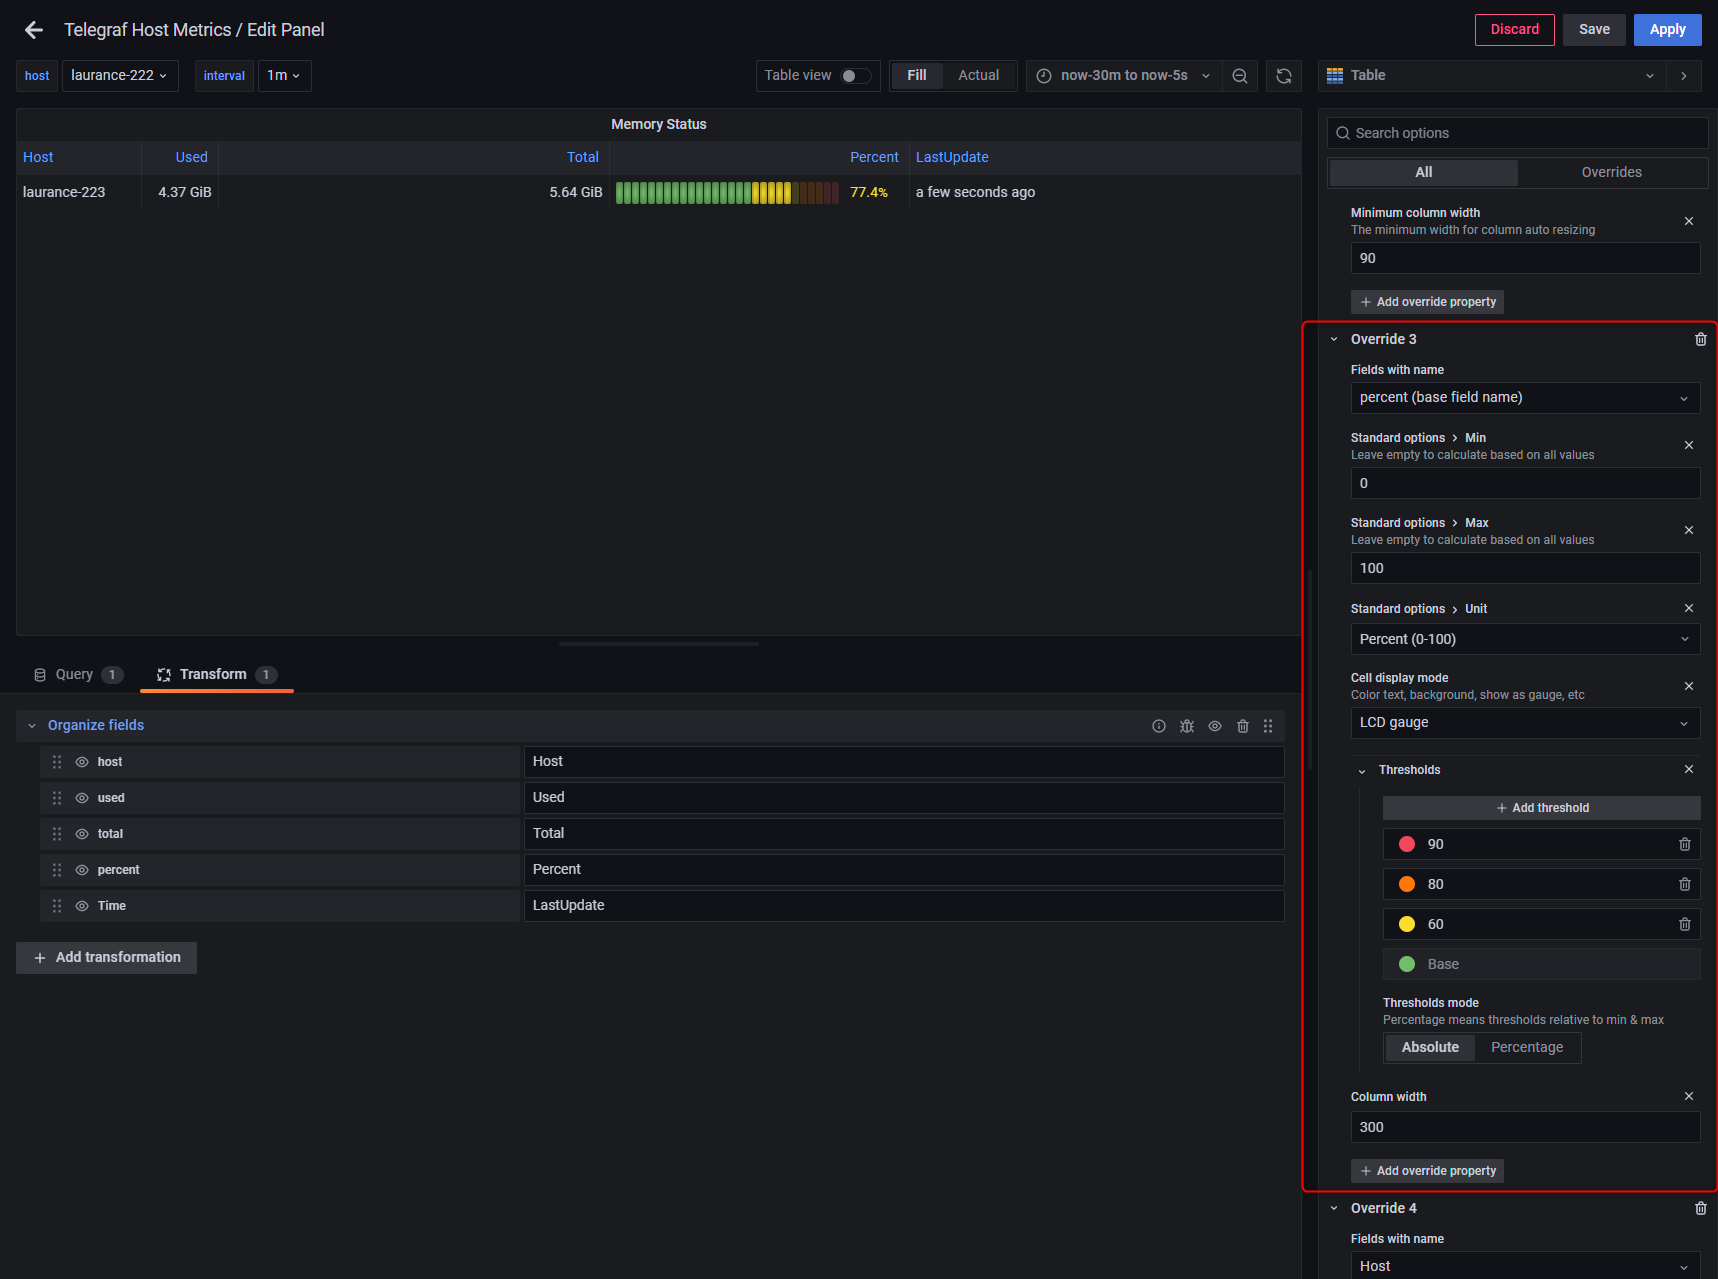
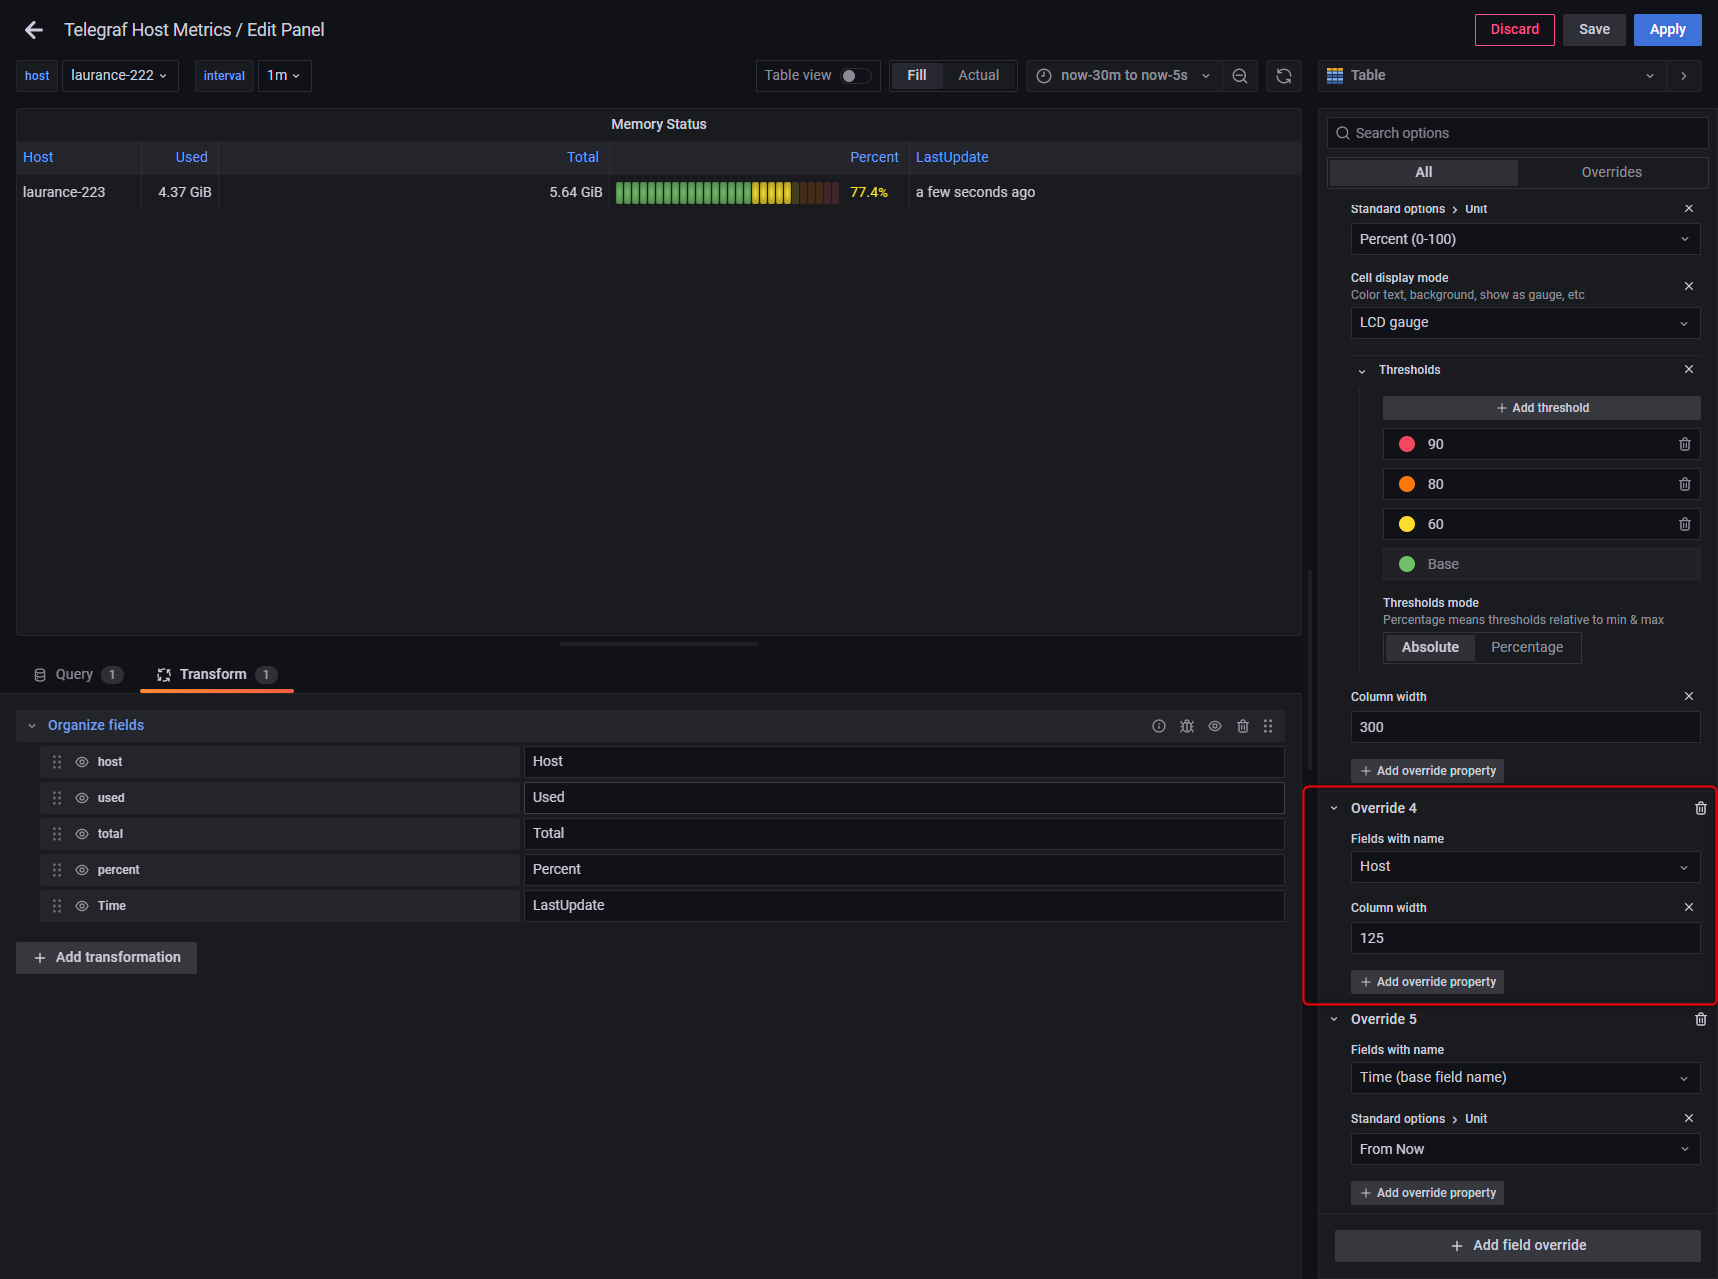
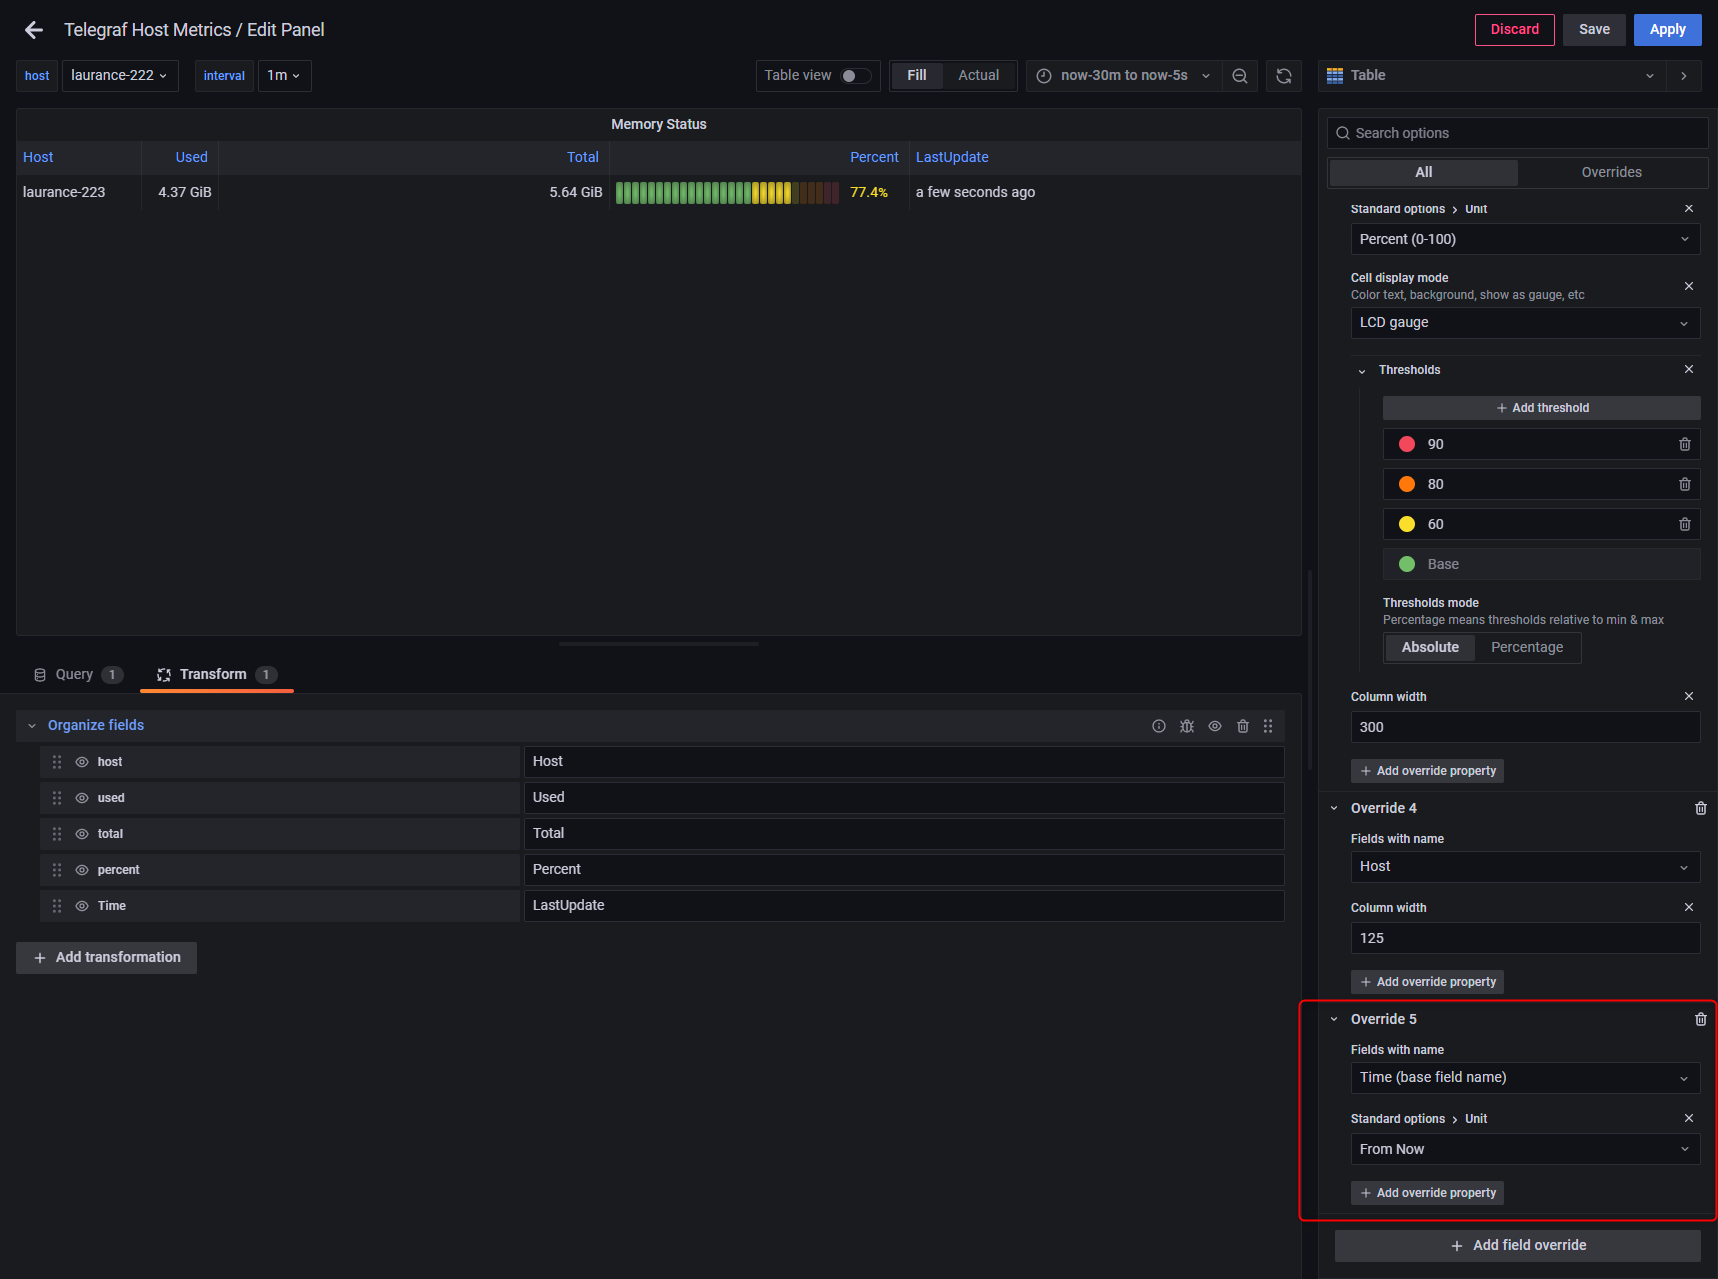
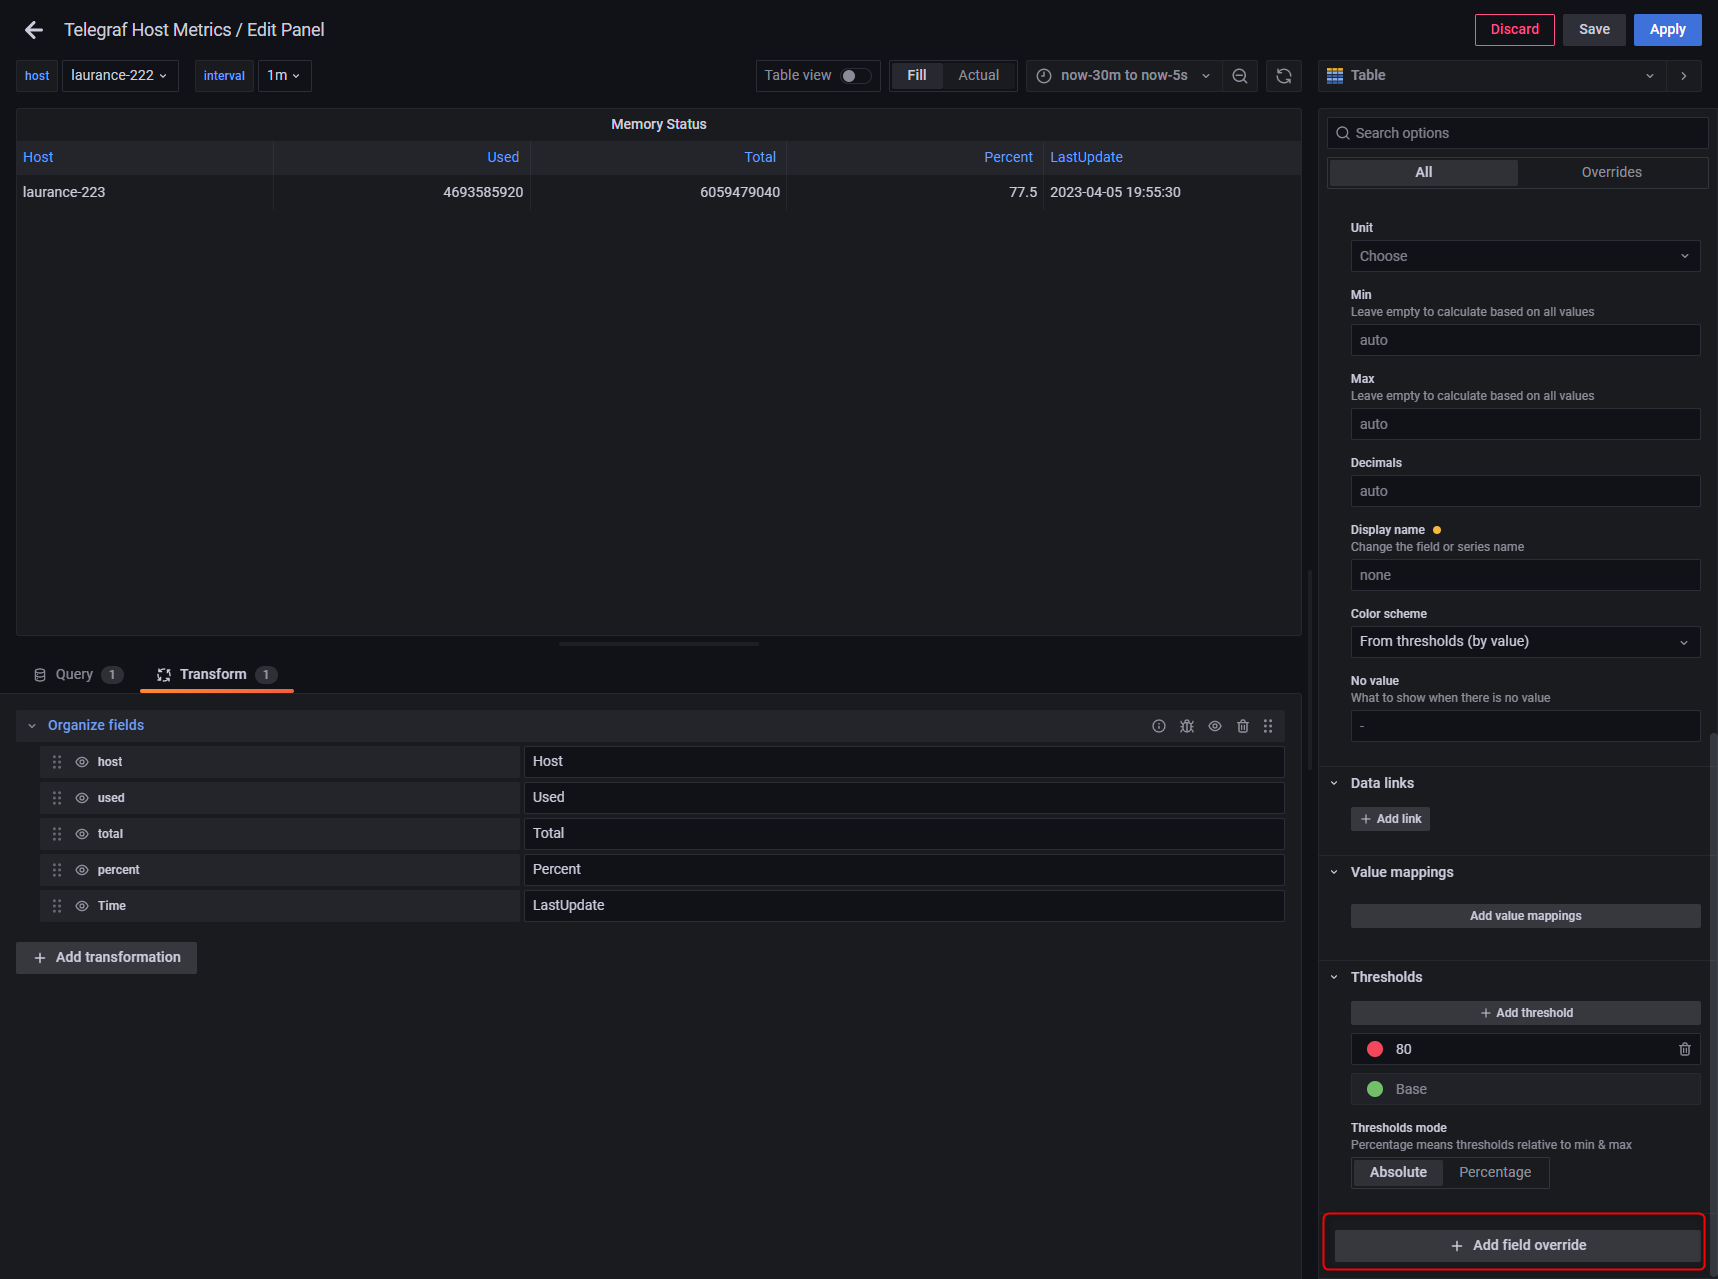
{step4} 右側條件選單拉到最底選擇 Add filed override
Override 1 & Override 2
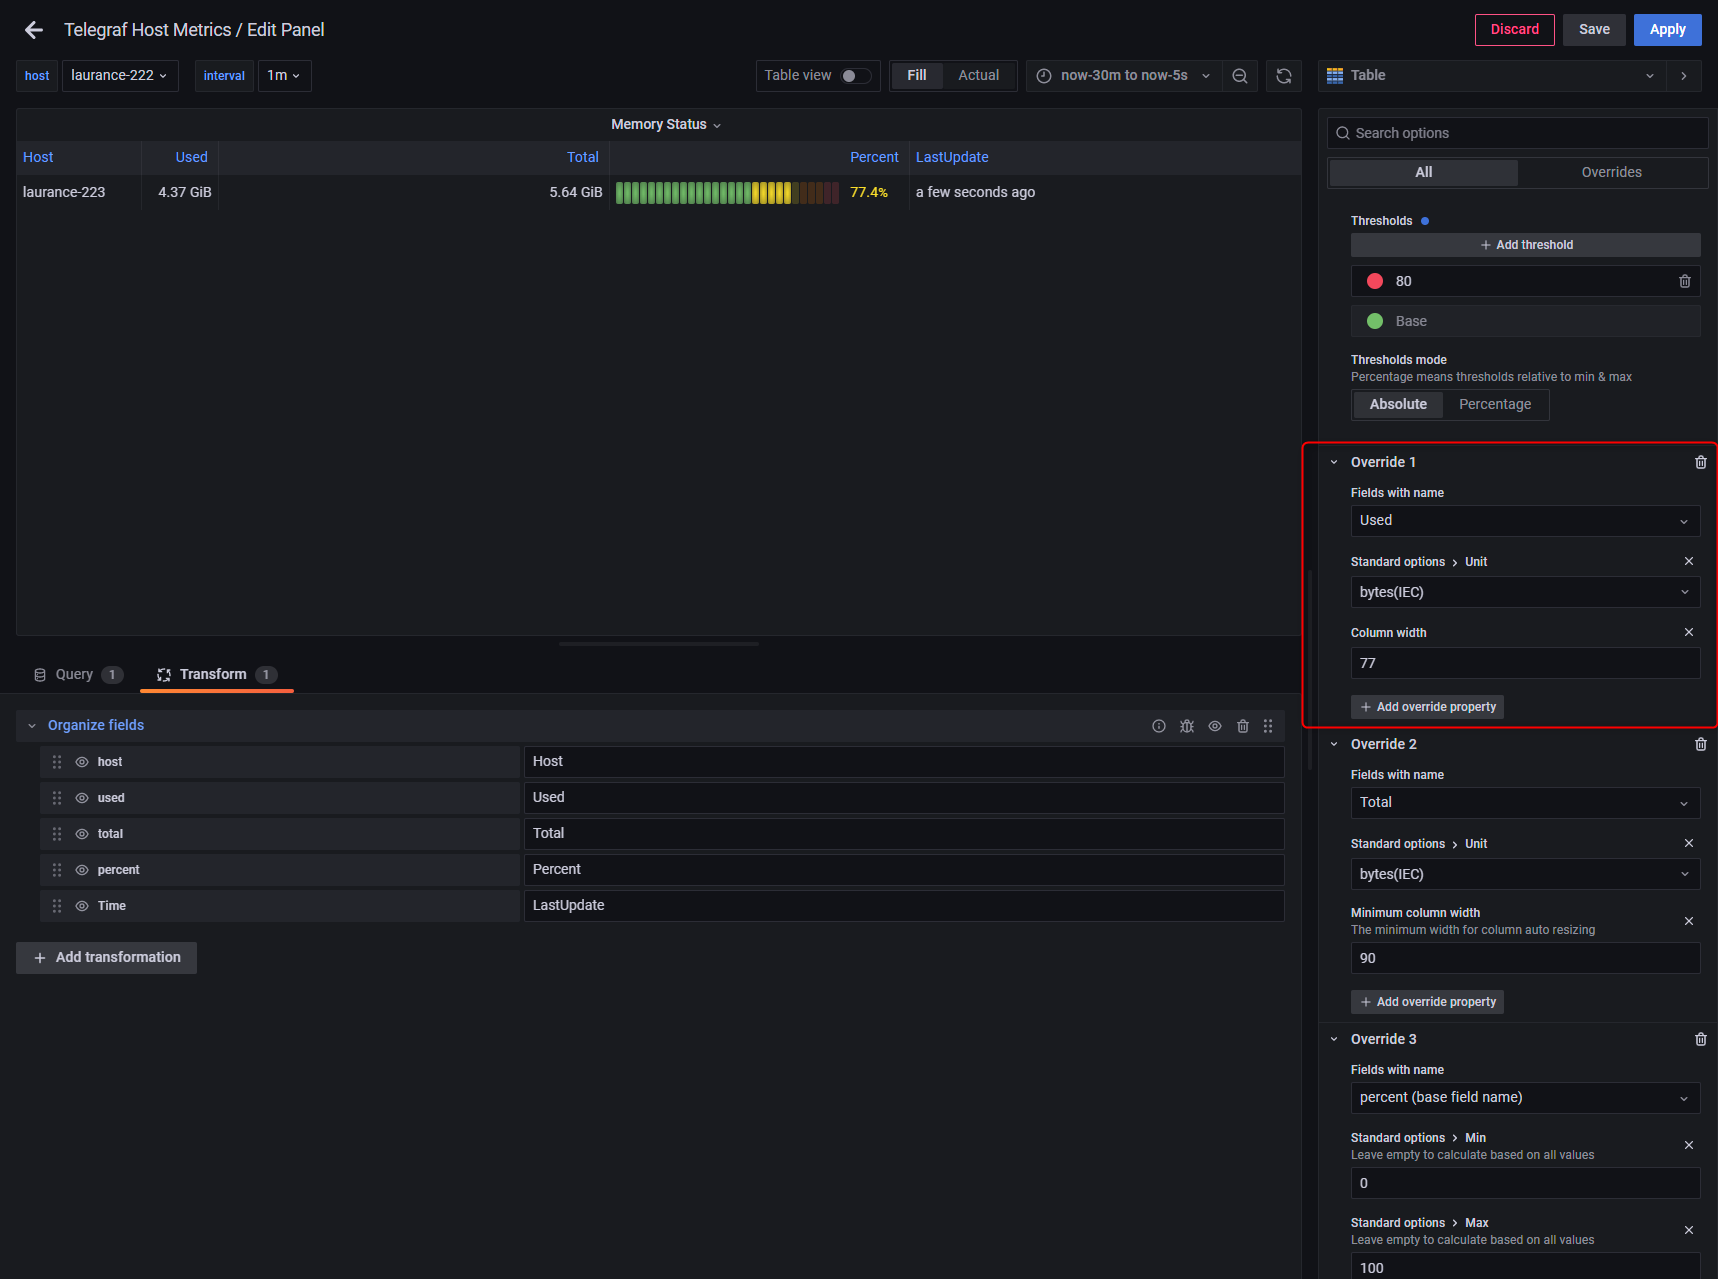
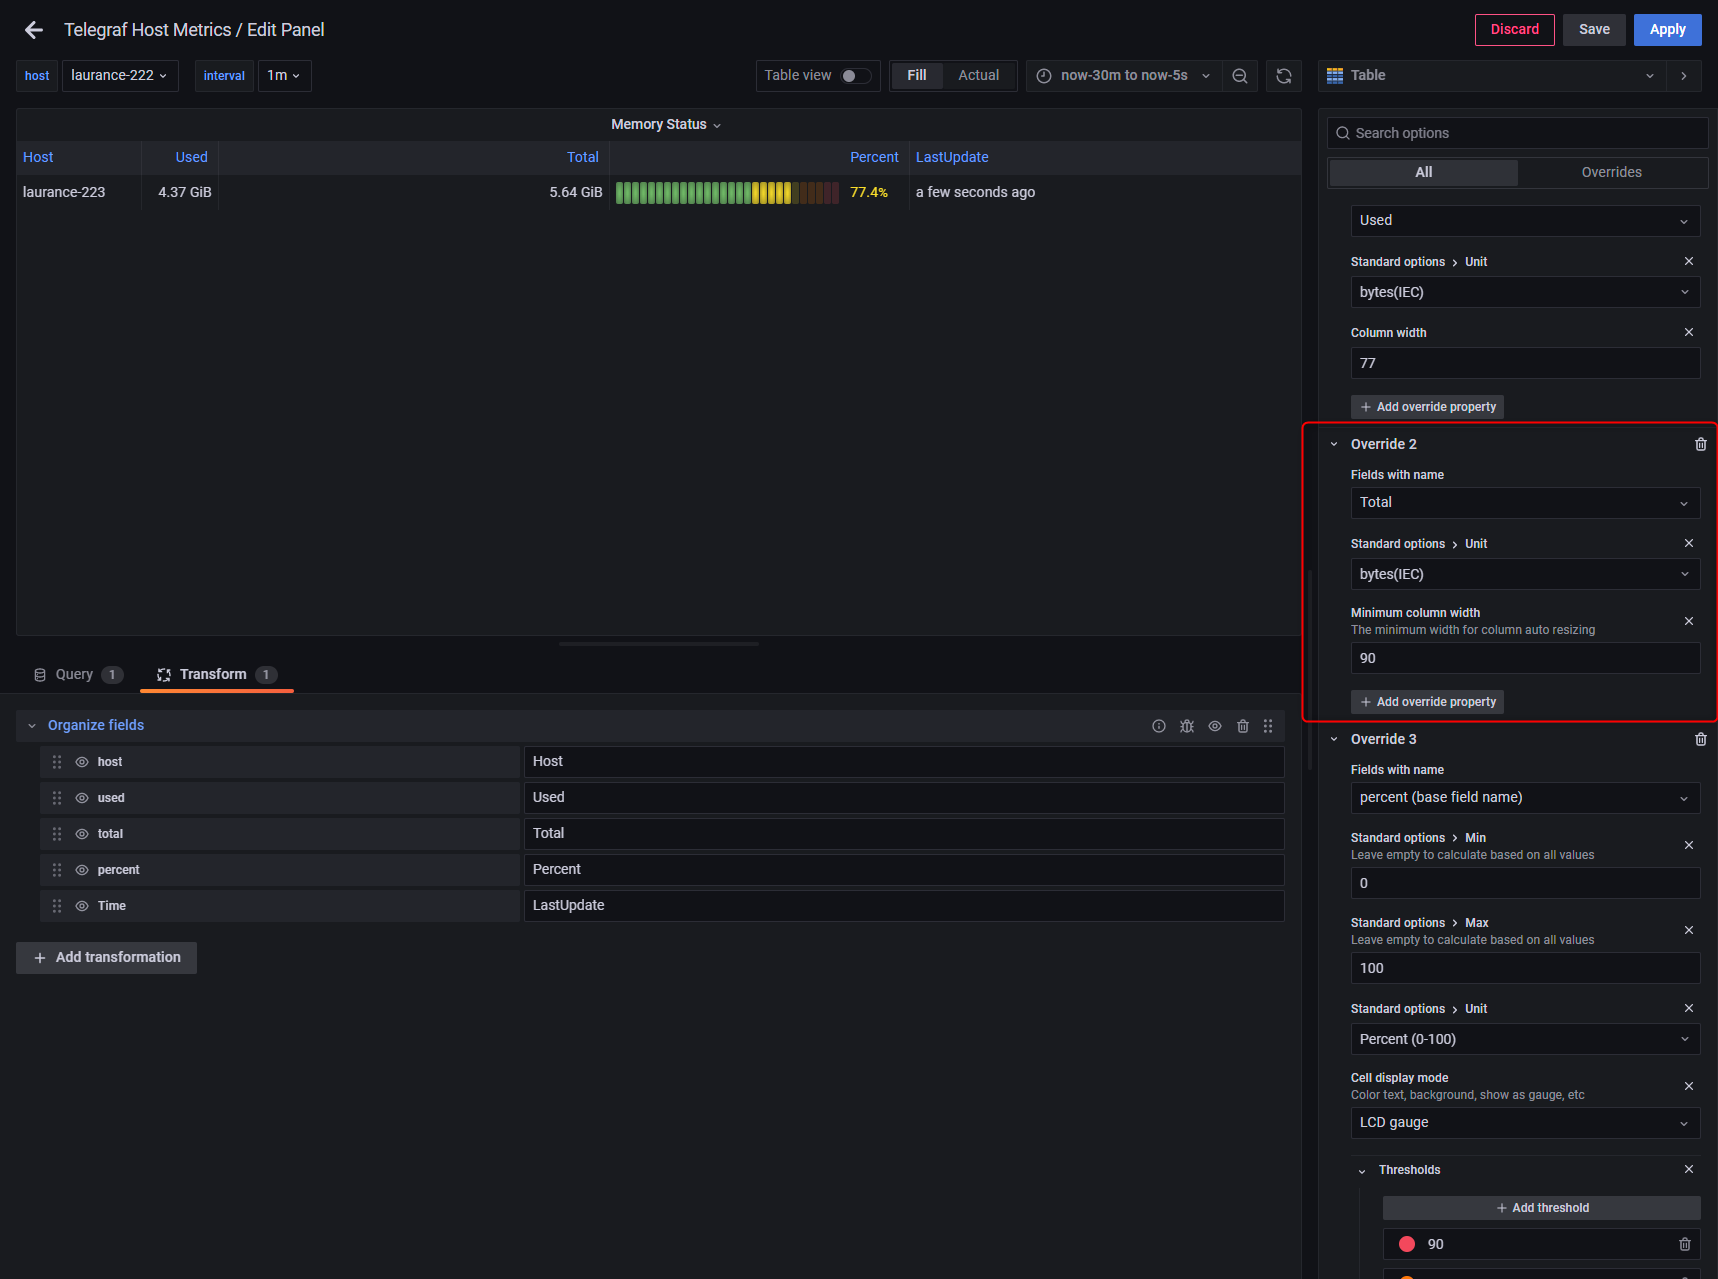
Override 3 & Override 4 & Override 5