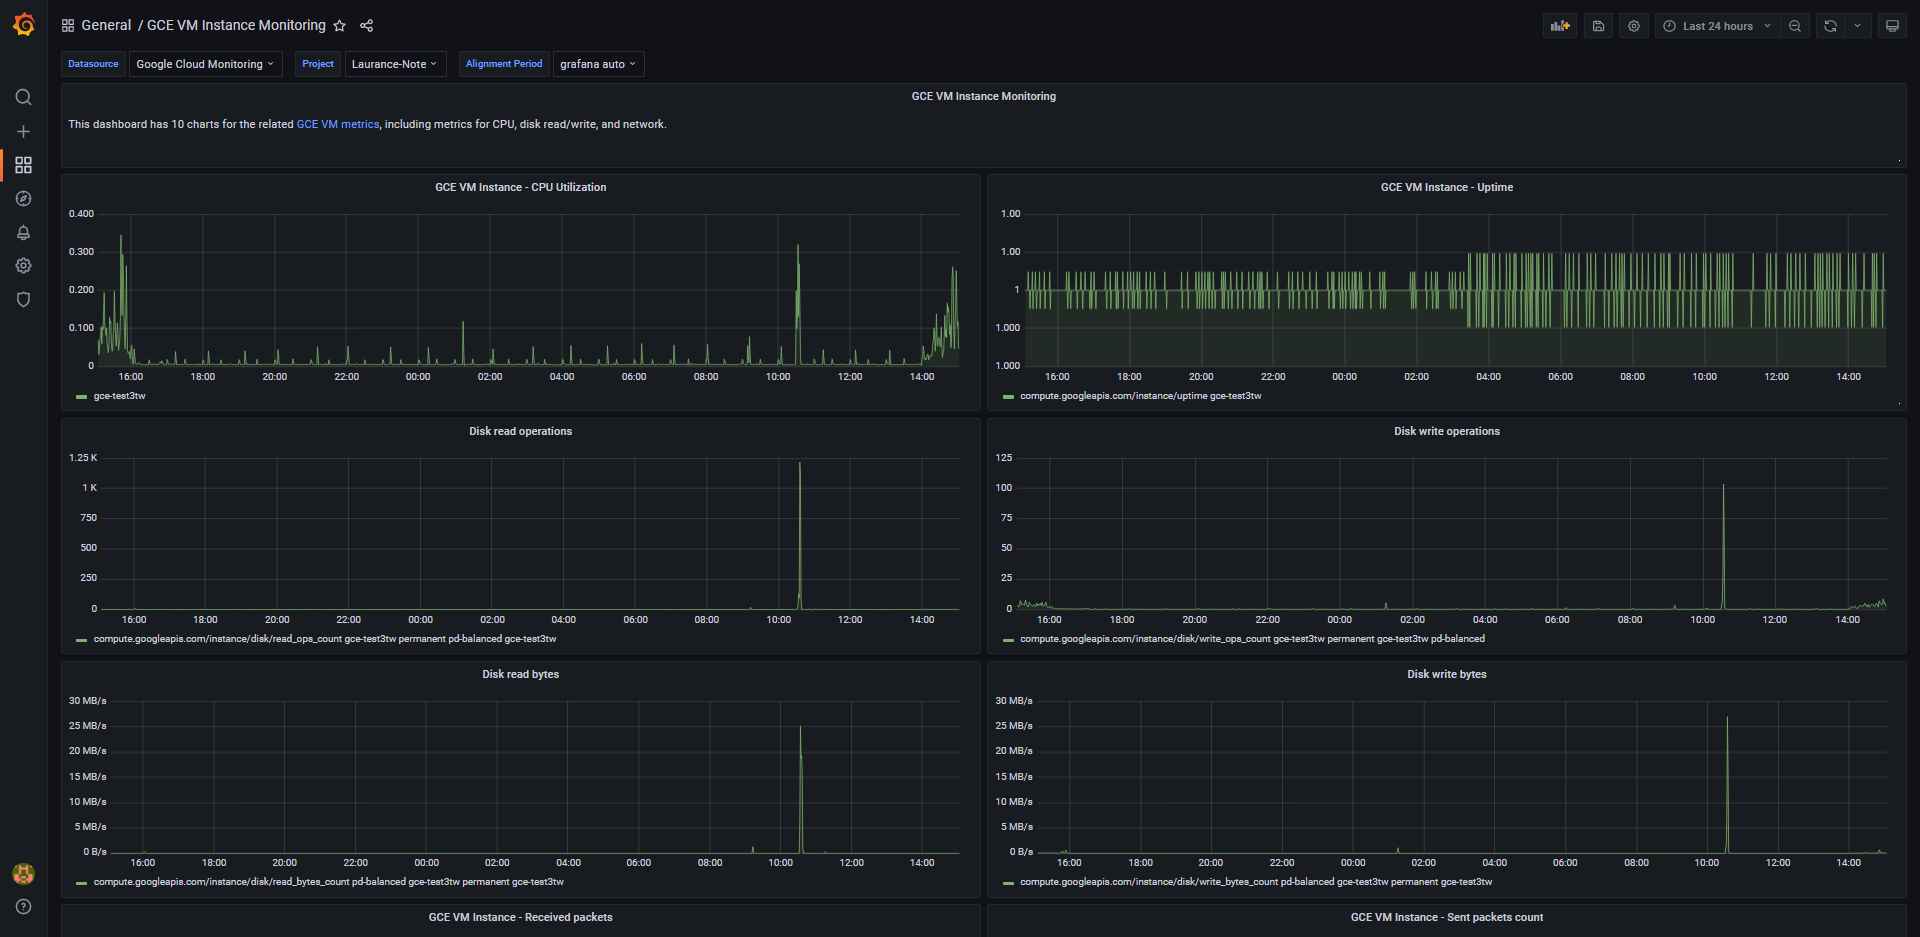
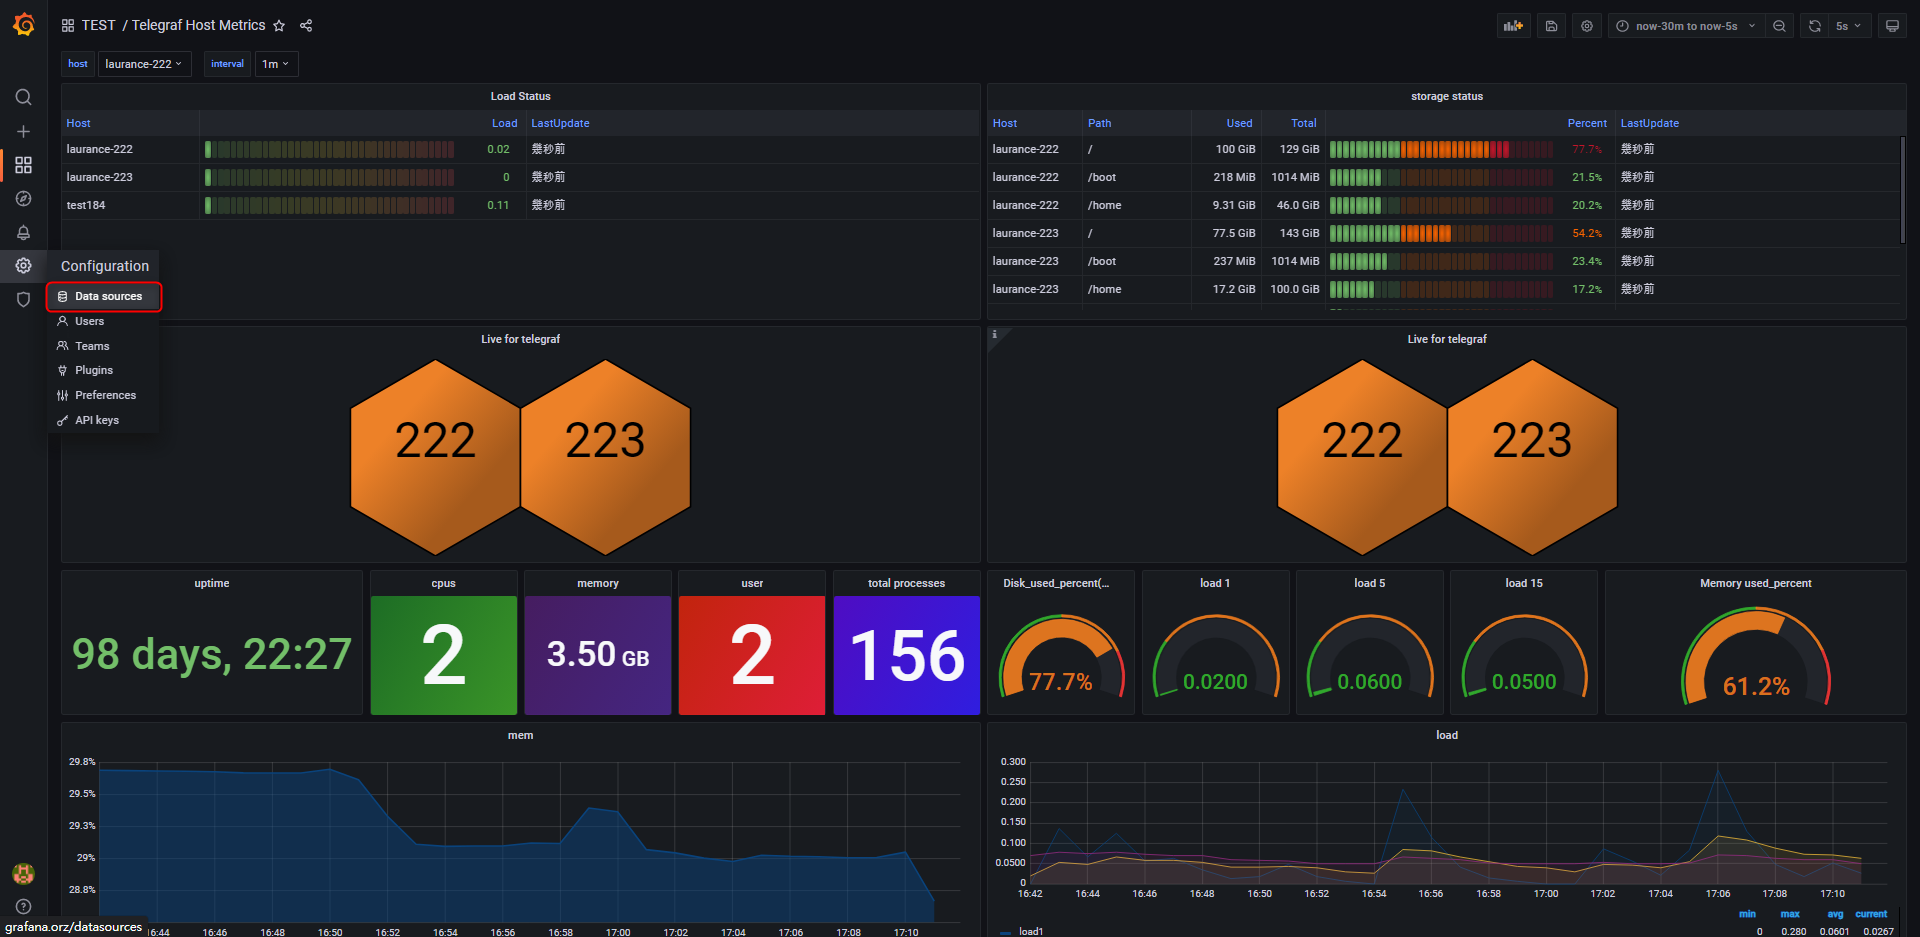
Grafana 系統搭配 GCP Monitoring 資訊做監控
GCP 設定
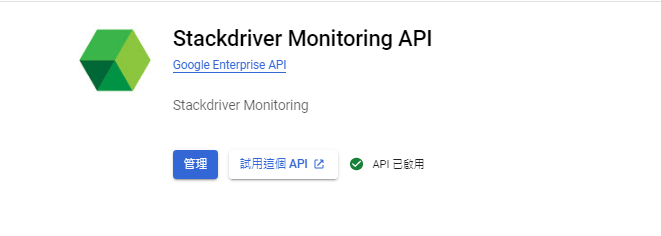
{STEP 1} 啟用API服務 Stackdriver Monitoring API
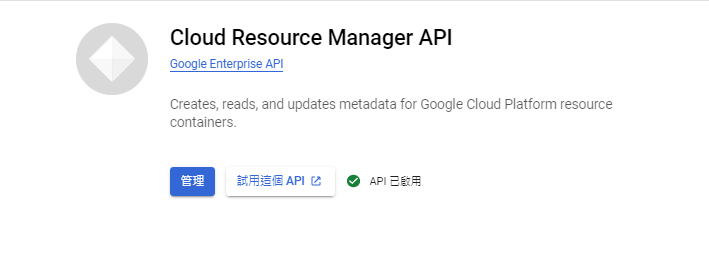
{STEP 2} 啟用API服務 Cloud Resource Manager API
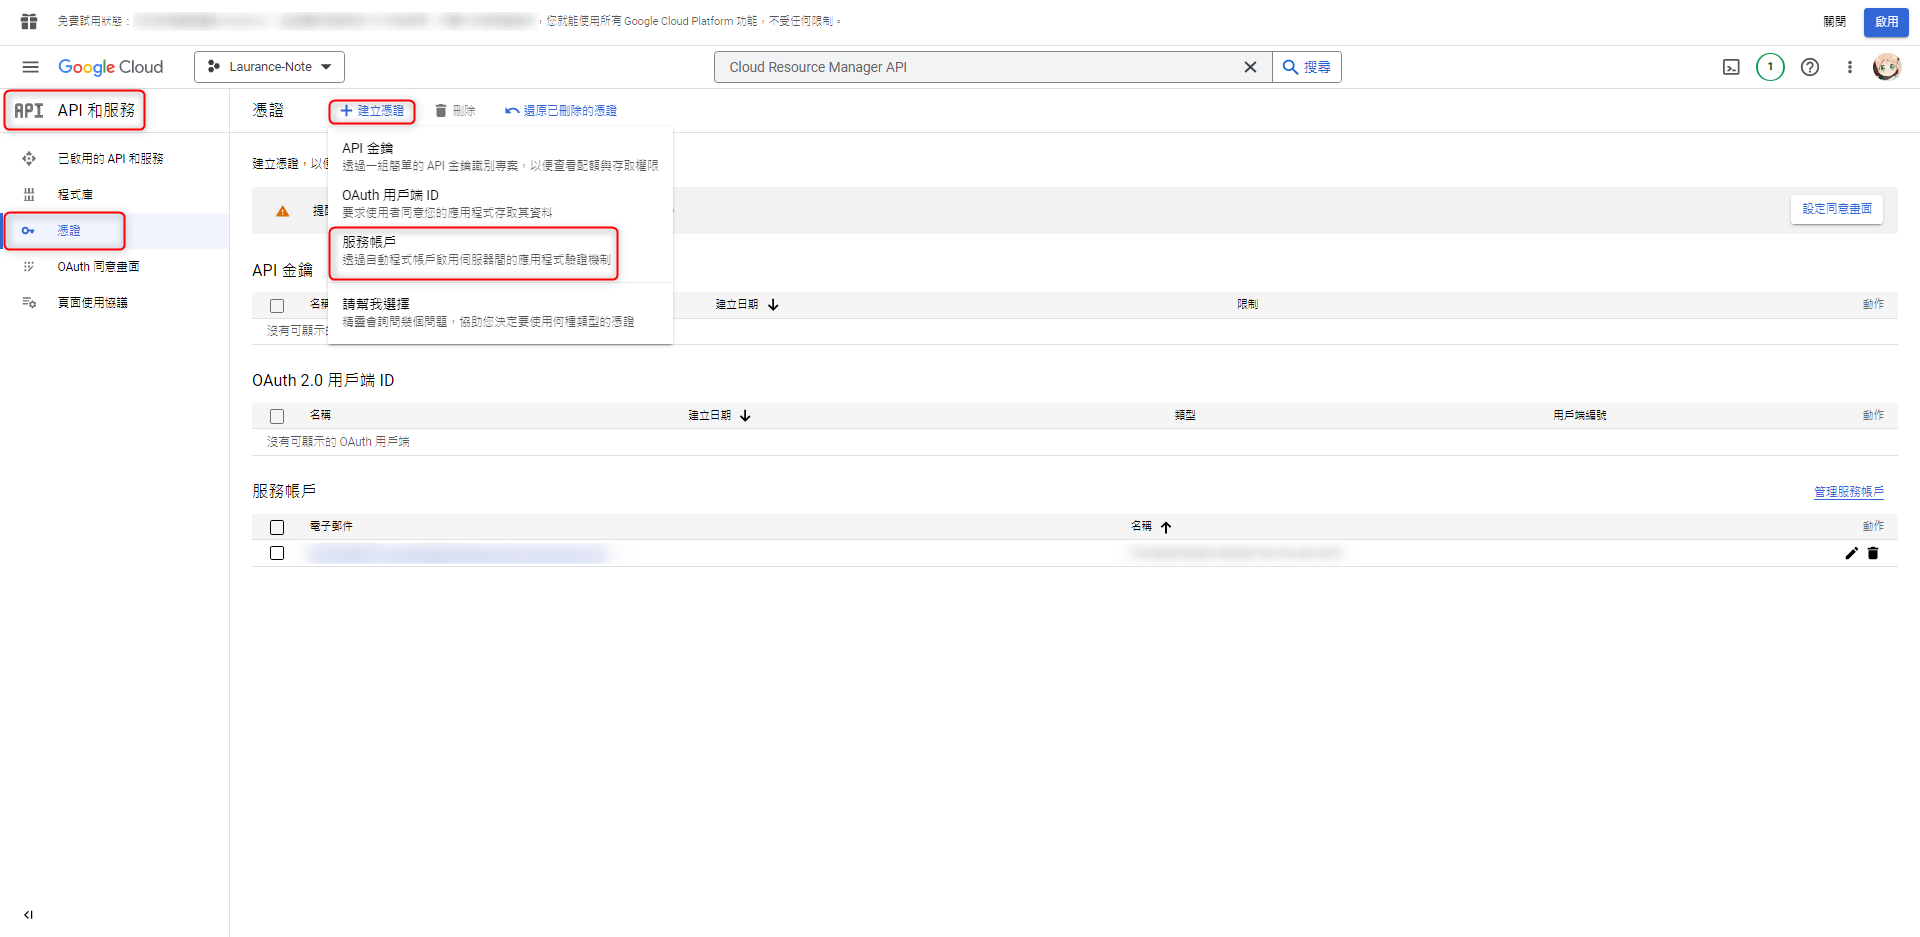
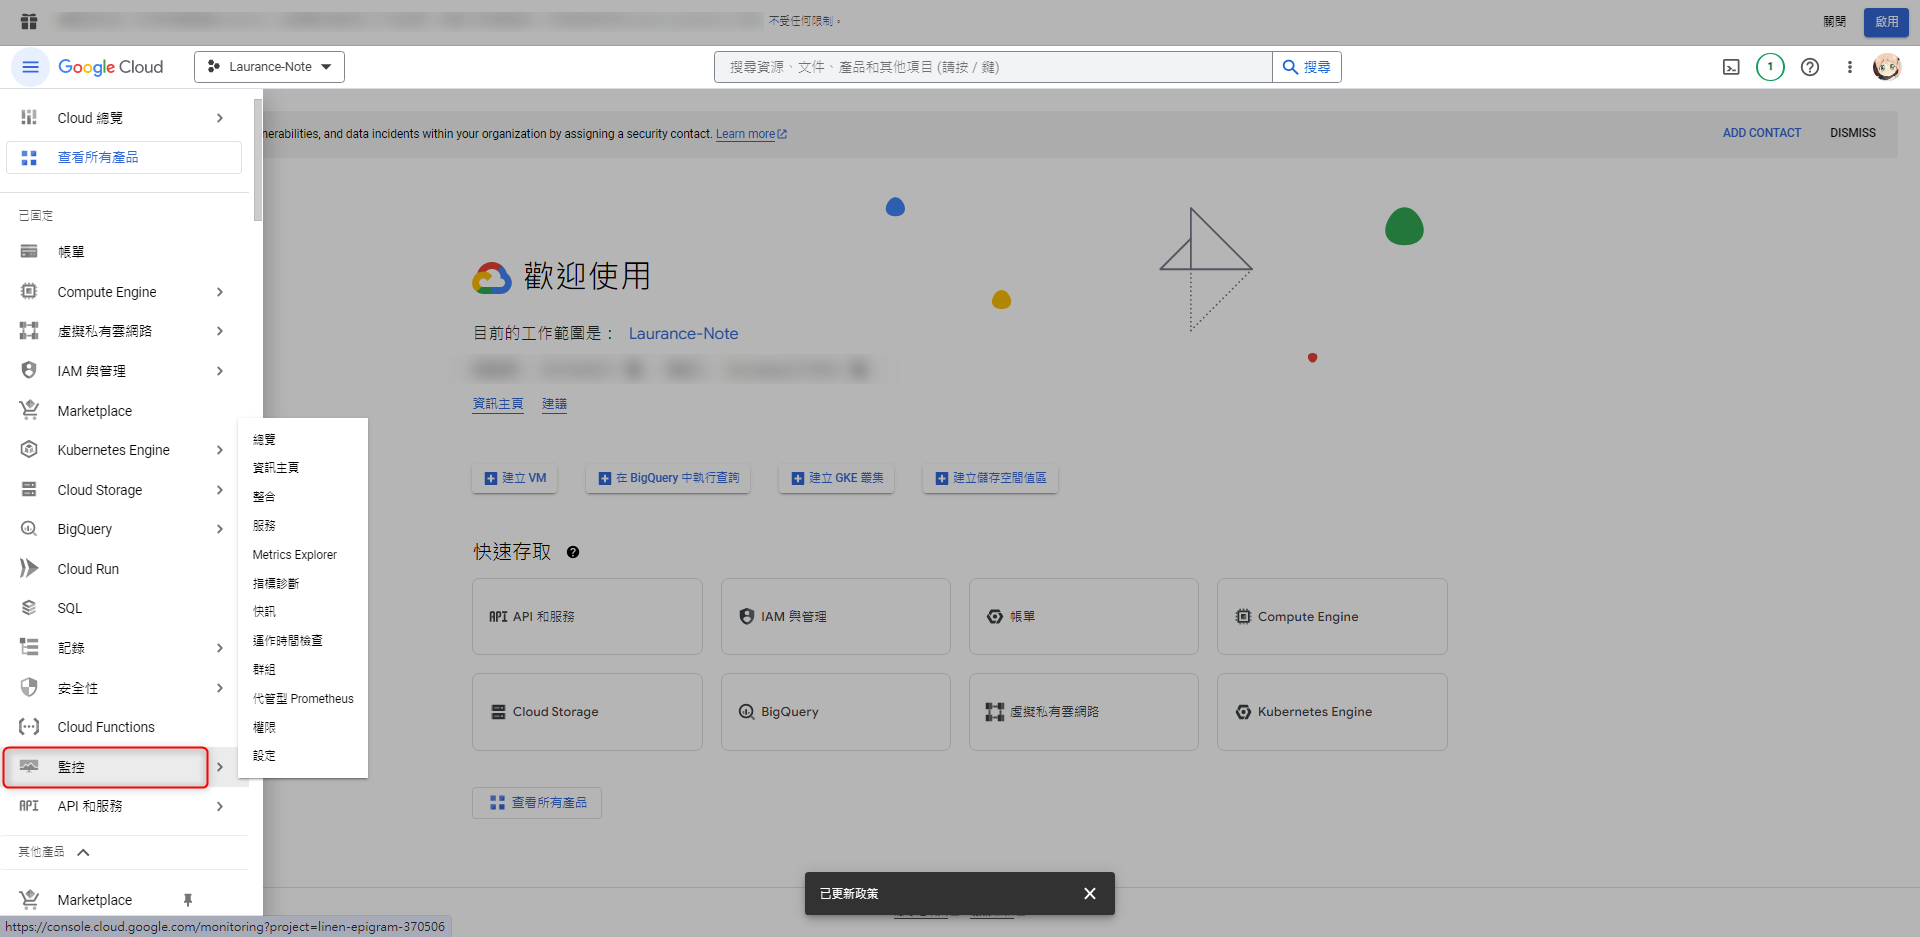
{STEP 3} 點選 API和服務 建立服務帳號憑證
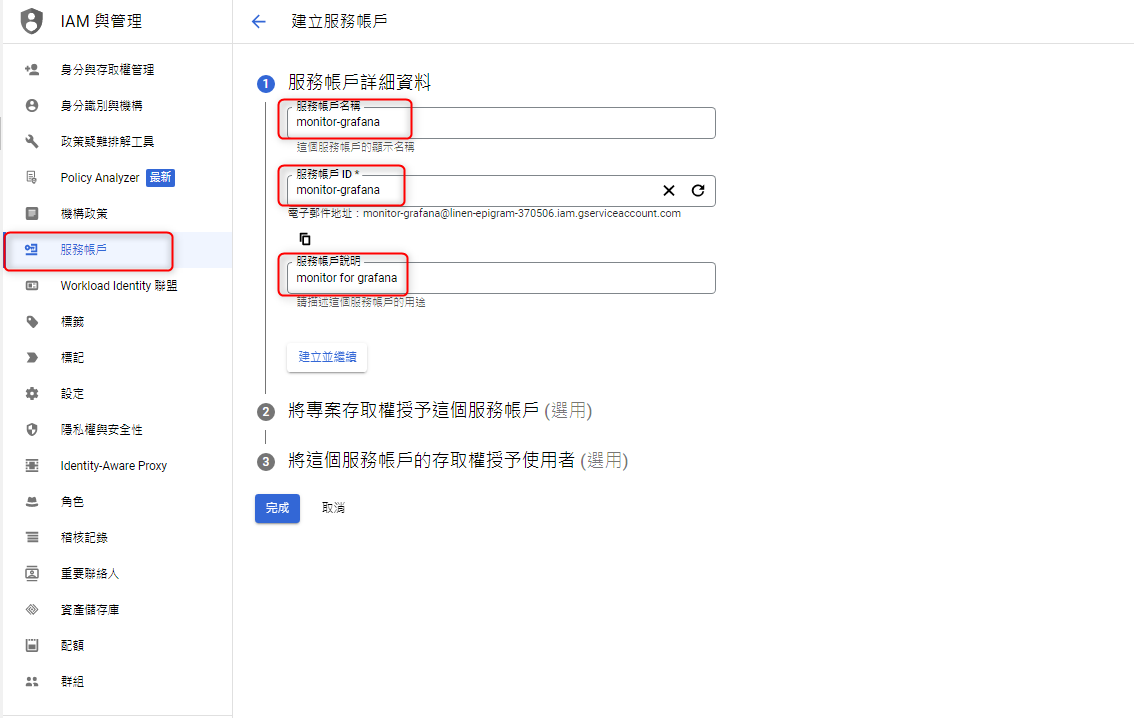
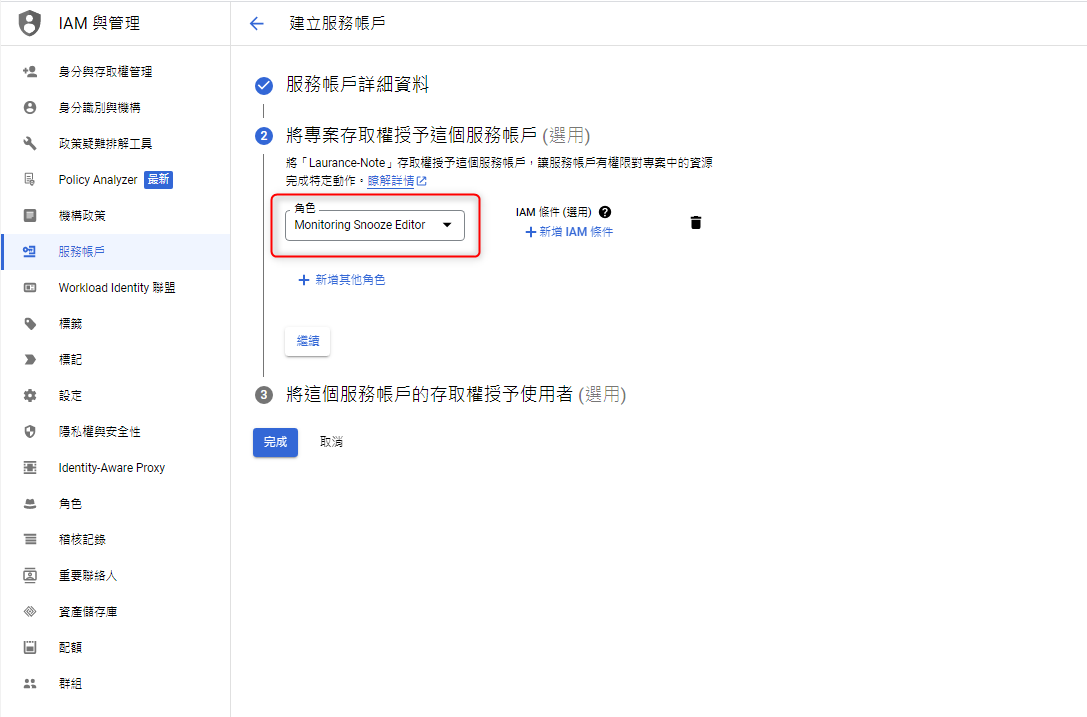
{STEP 4} 設定服務帳號名稱及設定該帳號權限
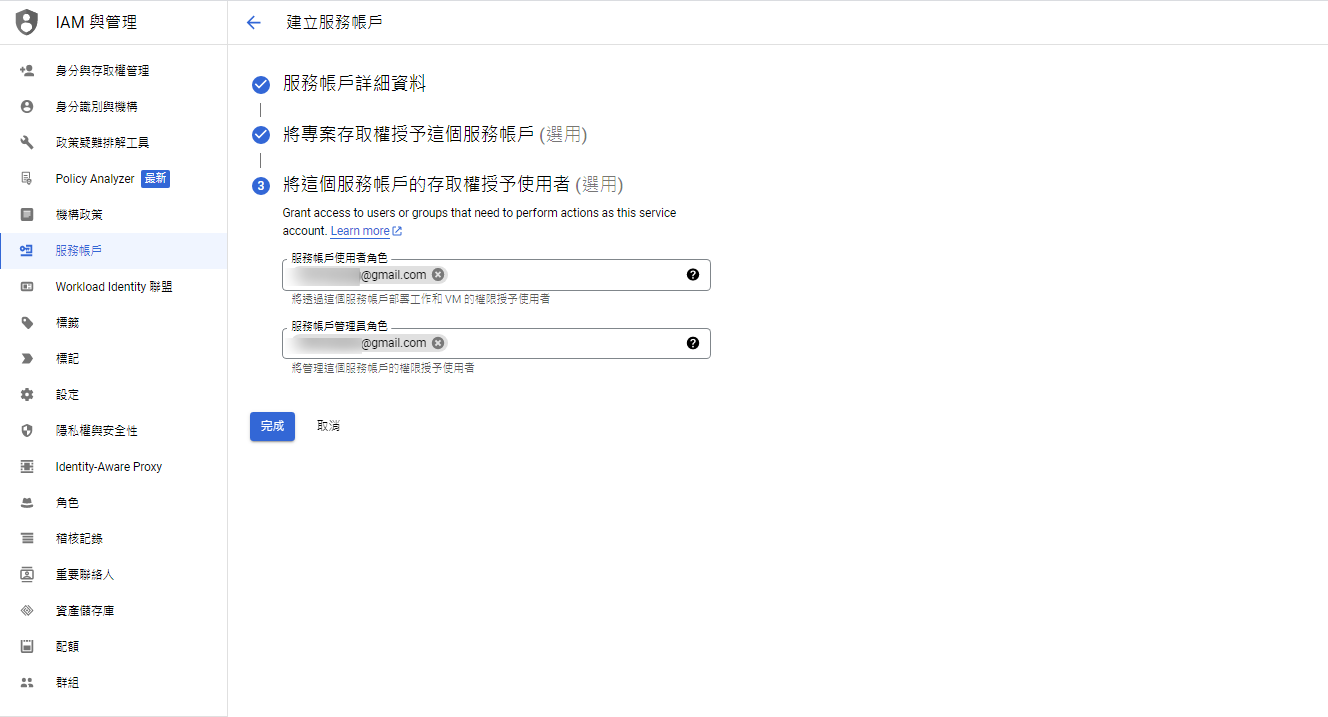
{STEP 5} 設定 授權此帳號的使用者
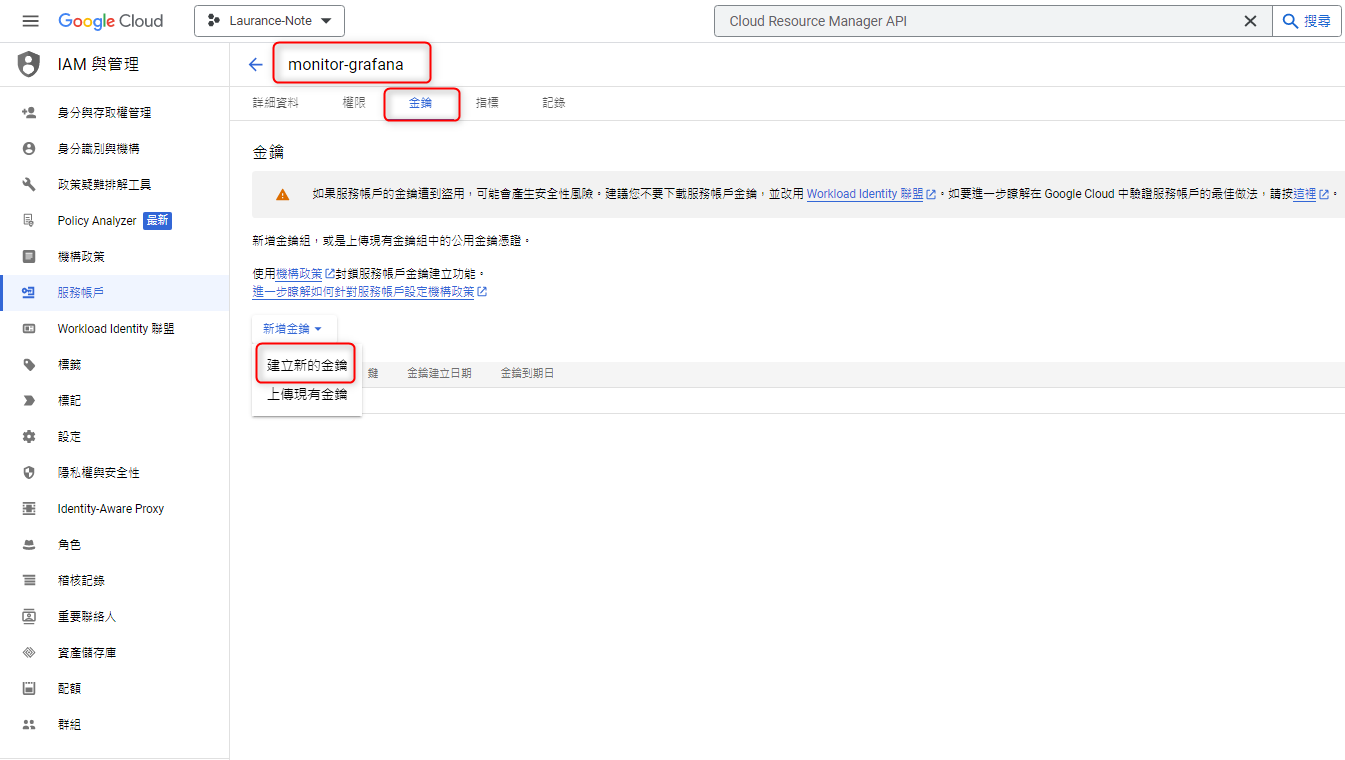
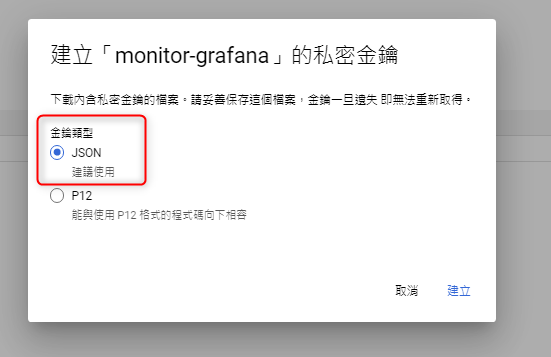
{STEP 6} 點選剛建立的監控服務帳號 monitor-grafana 並建立 JSON 金鑰
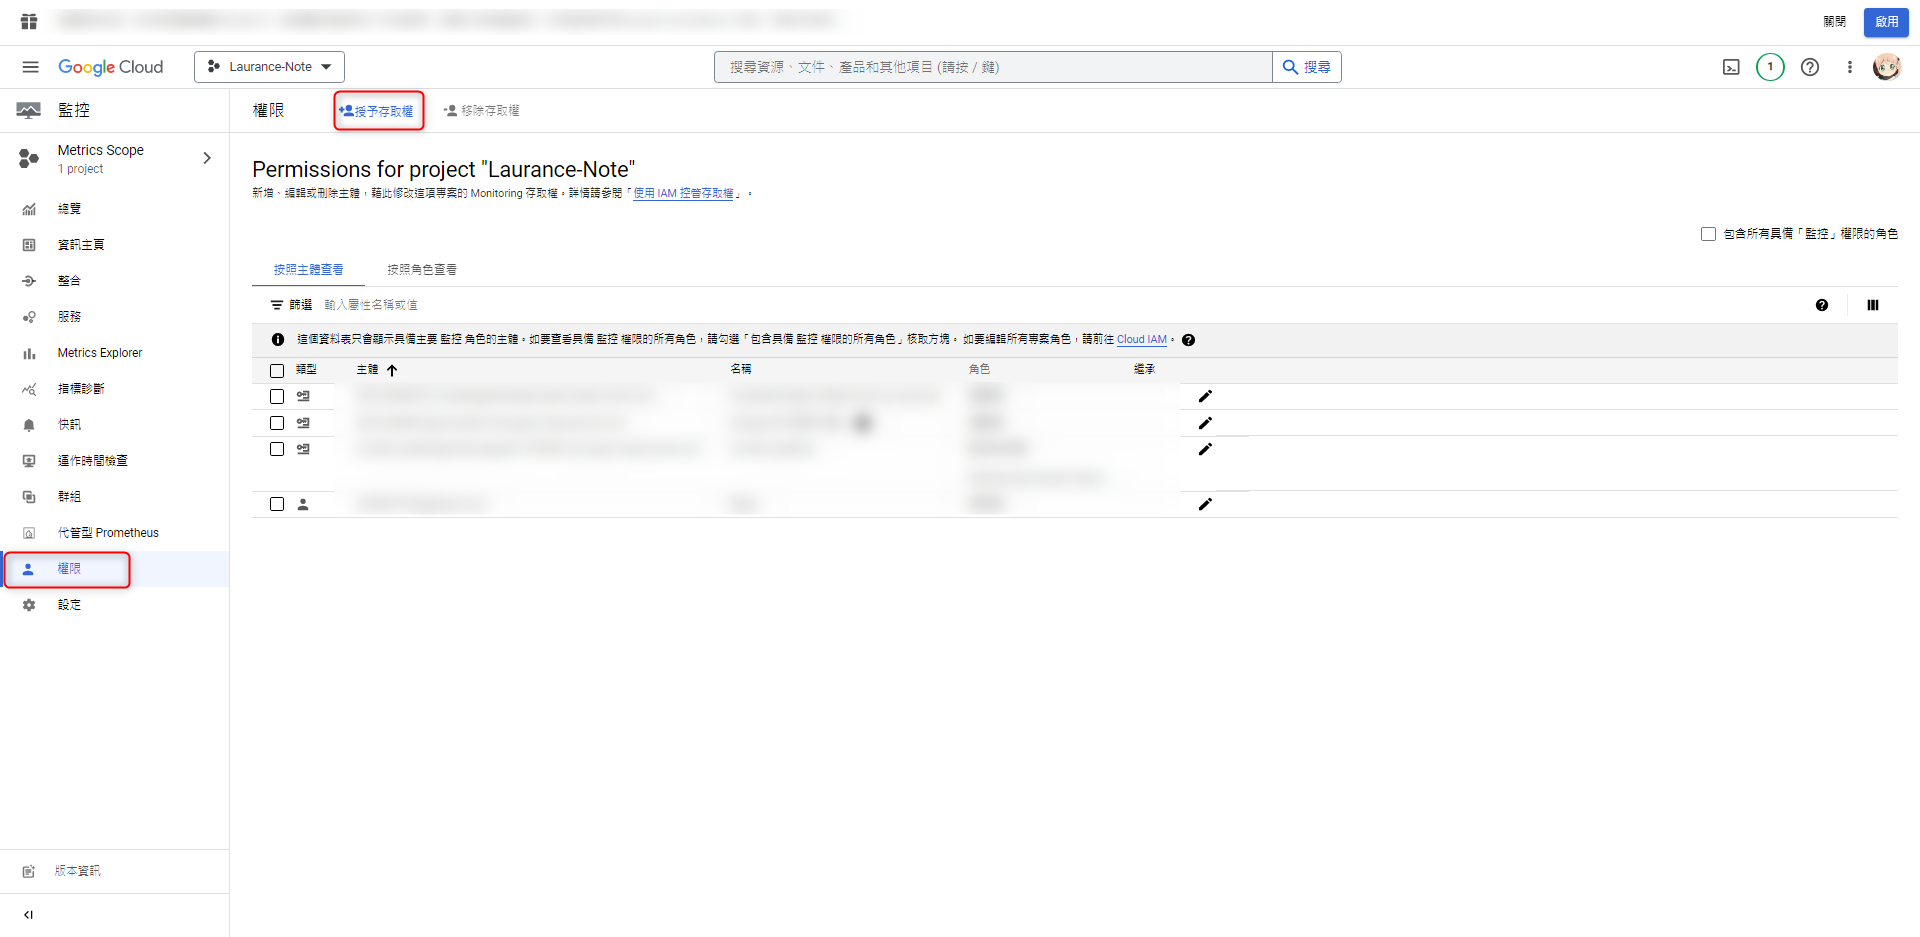
{STEP 7} 添加監控權限 For Monitor
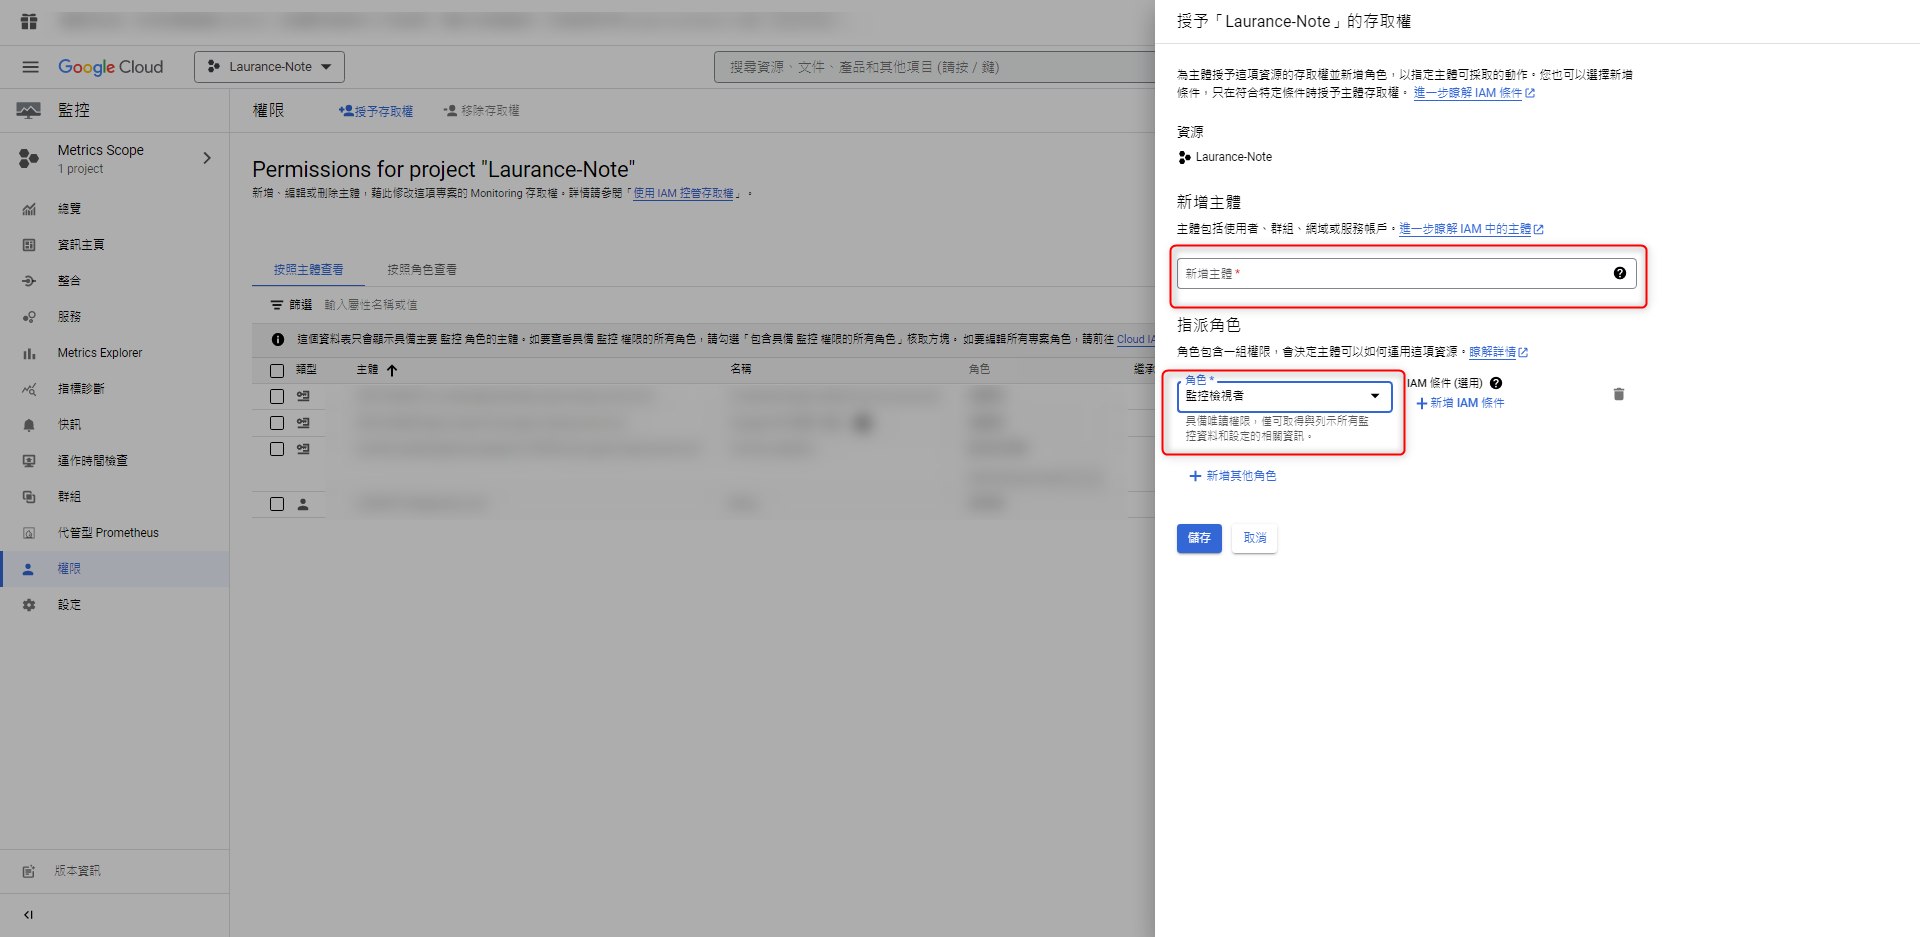
添加 授權使用者
新增主體: 剛建立的監控服務帳號 XXX.gmail
指派角色: 監控檢視者
Grafana
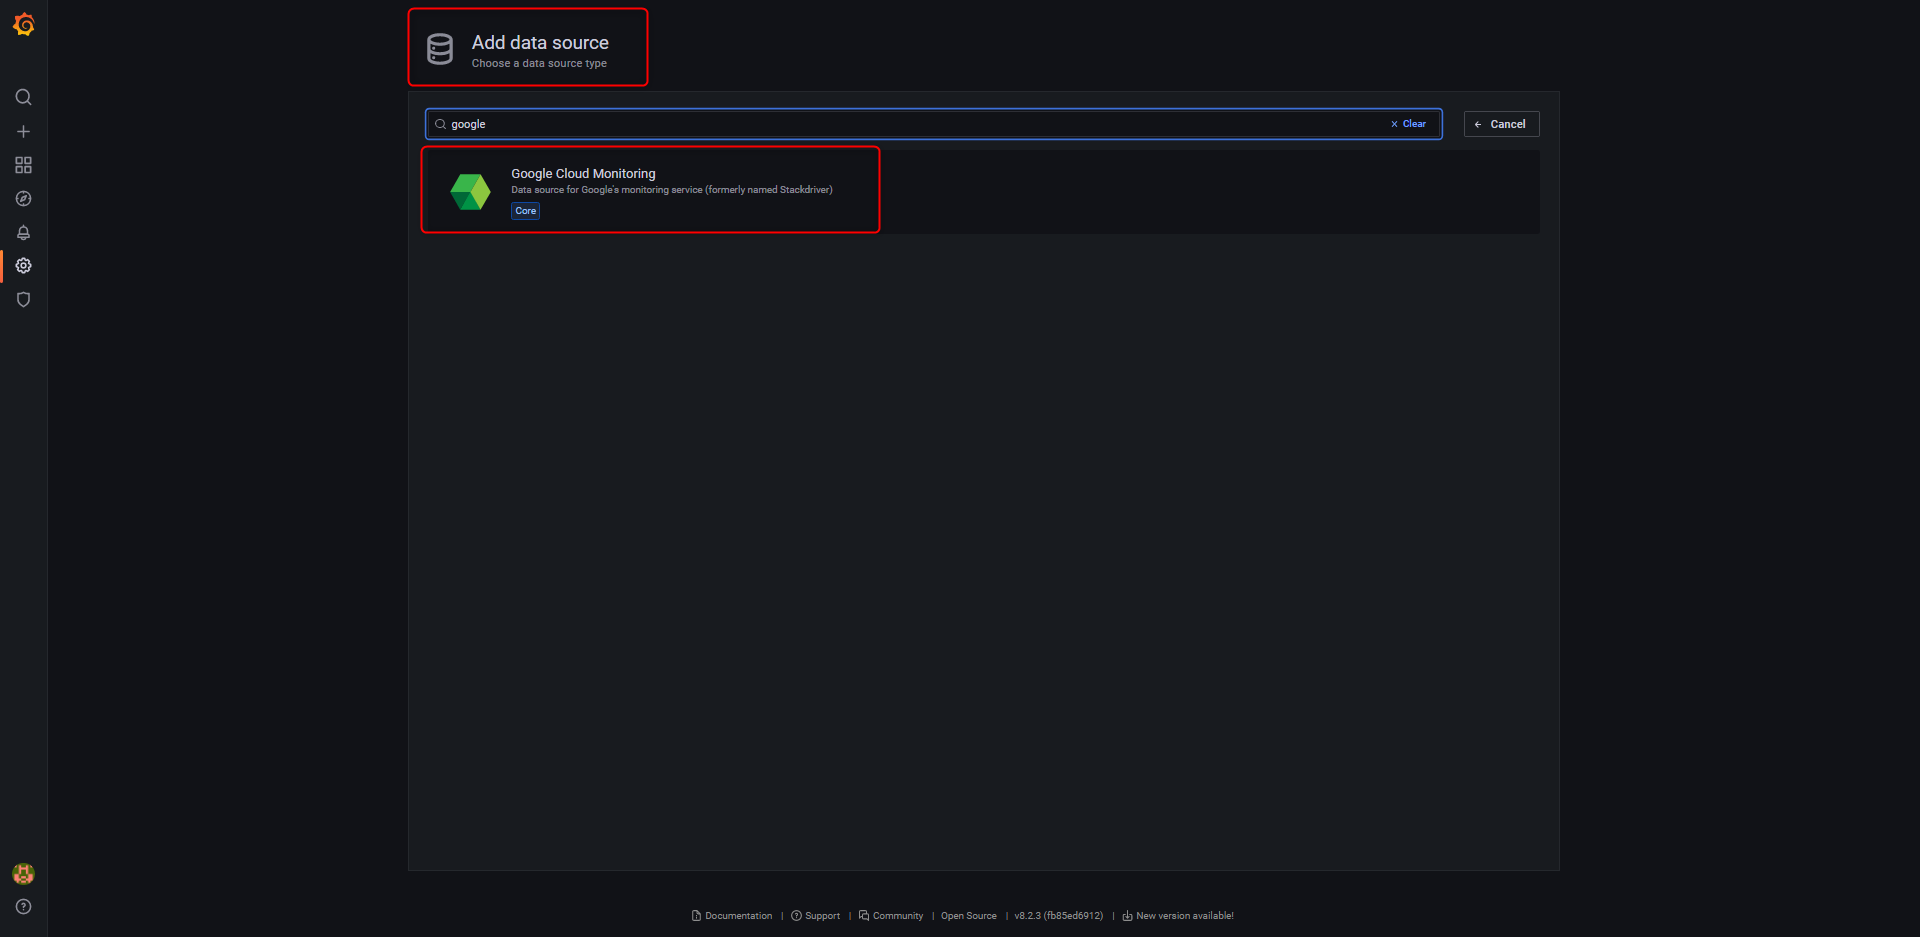
{STEP 8} 新增 Data source 資料來源 Google Cloud Monitoring
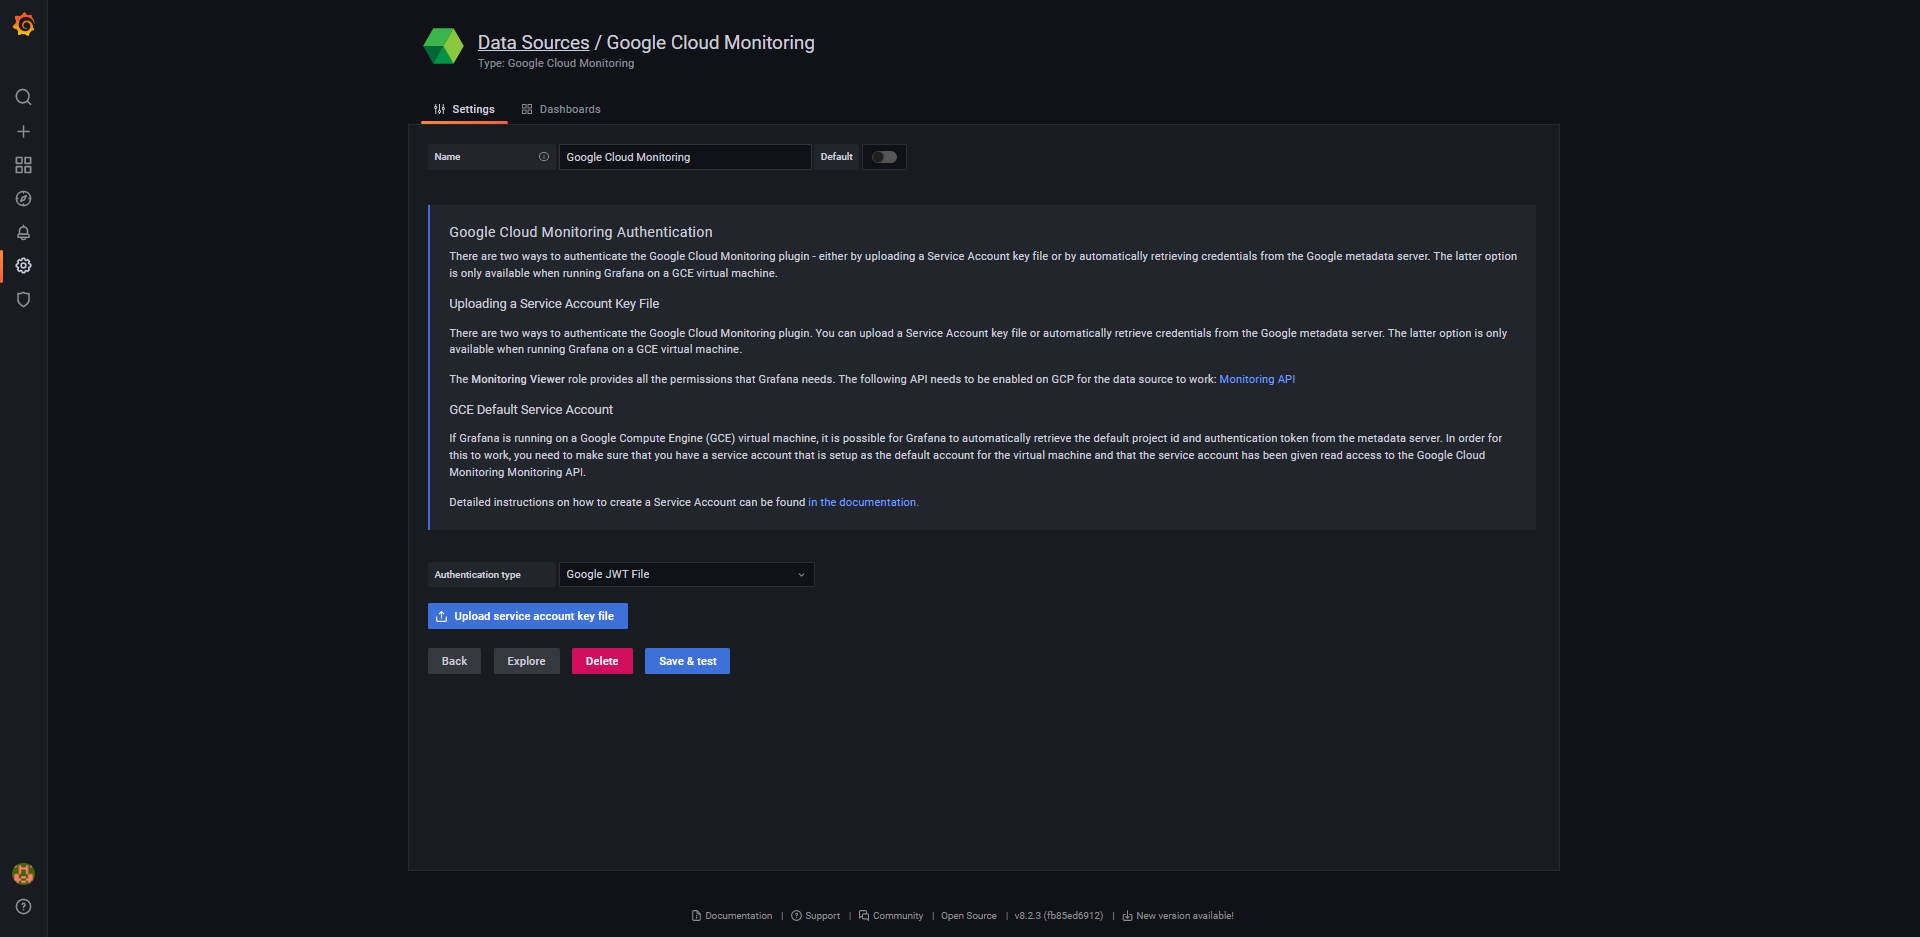
{STEP 9} 將 STEP 6 新增的 JSON 金鑰 上傳 && Save & test
選擇 Google JWT File
點選 Upload service account key file
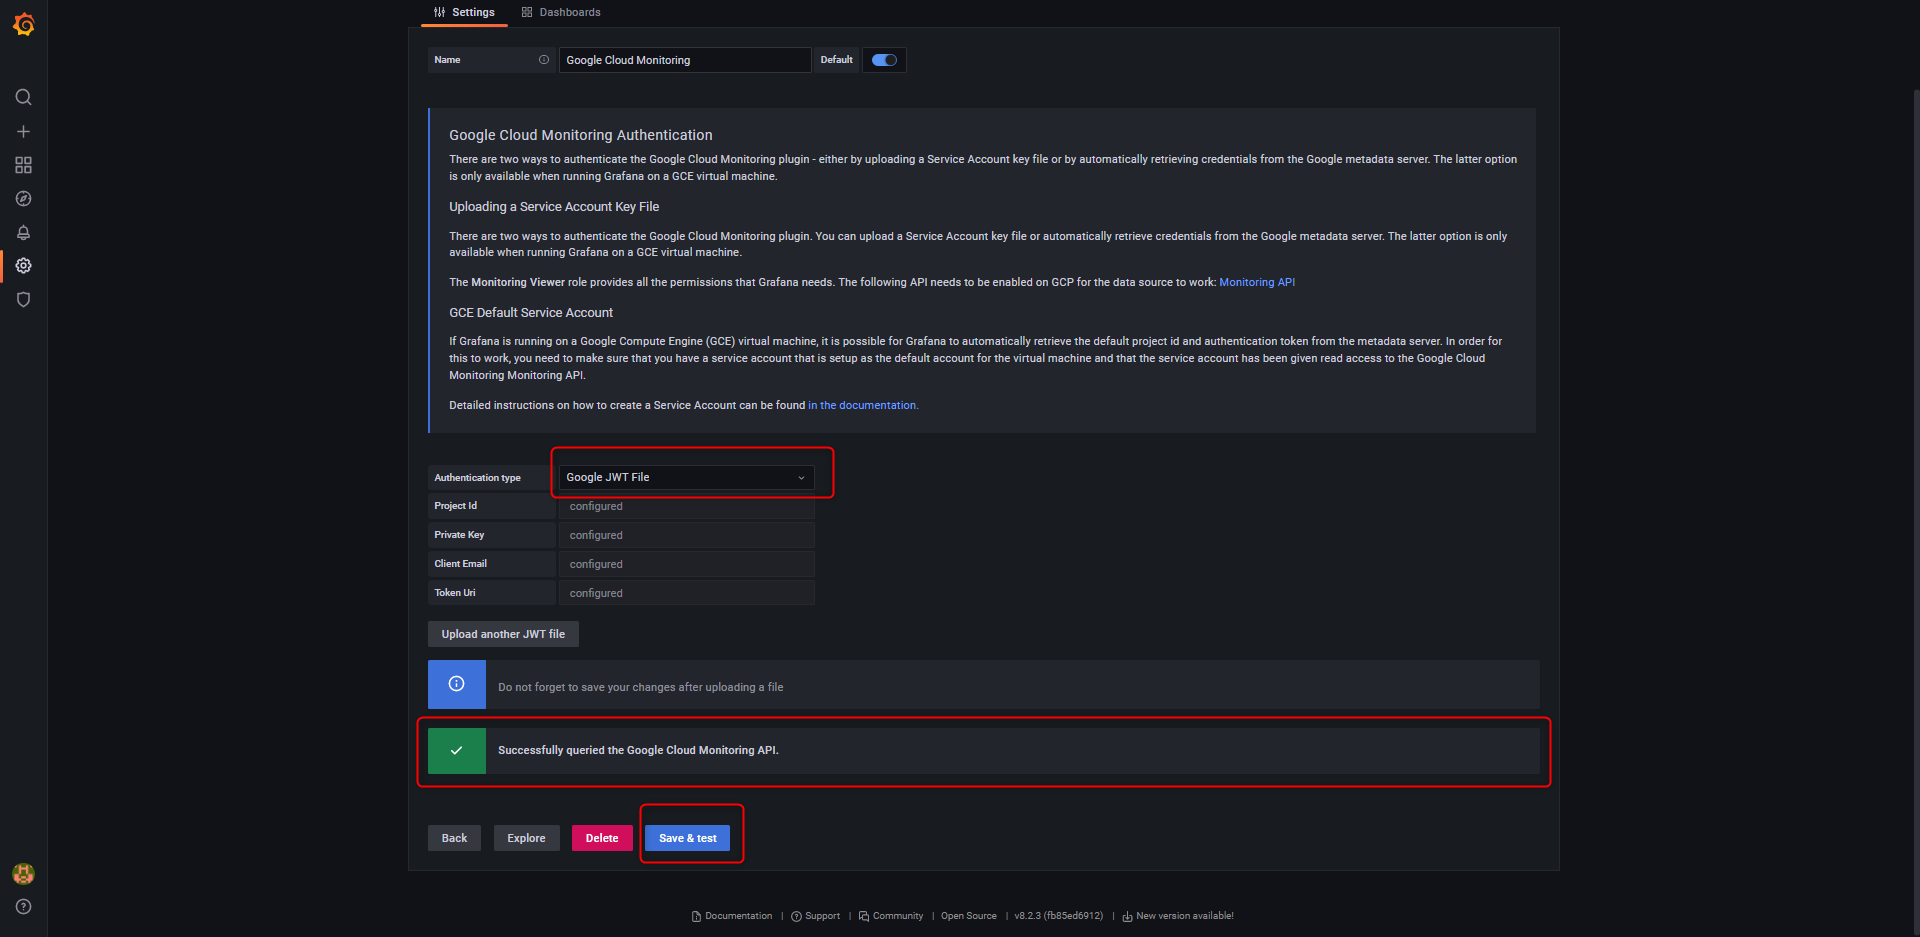
{STEP 10} 成果驗收